
Image
|
Figure Caption
Fig. S1
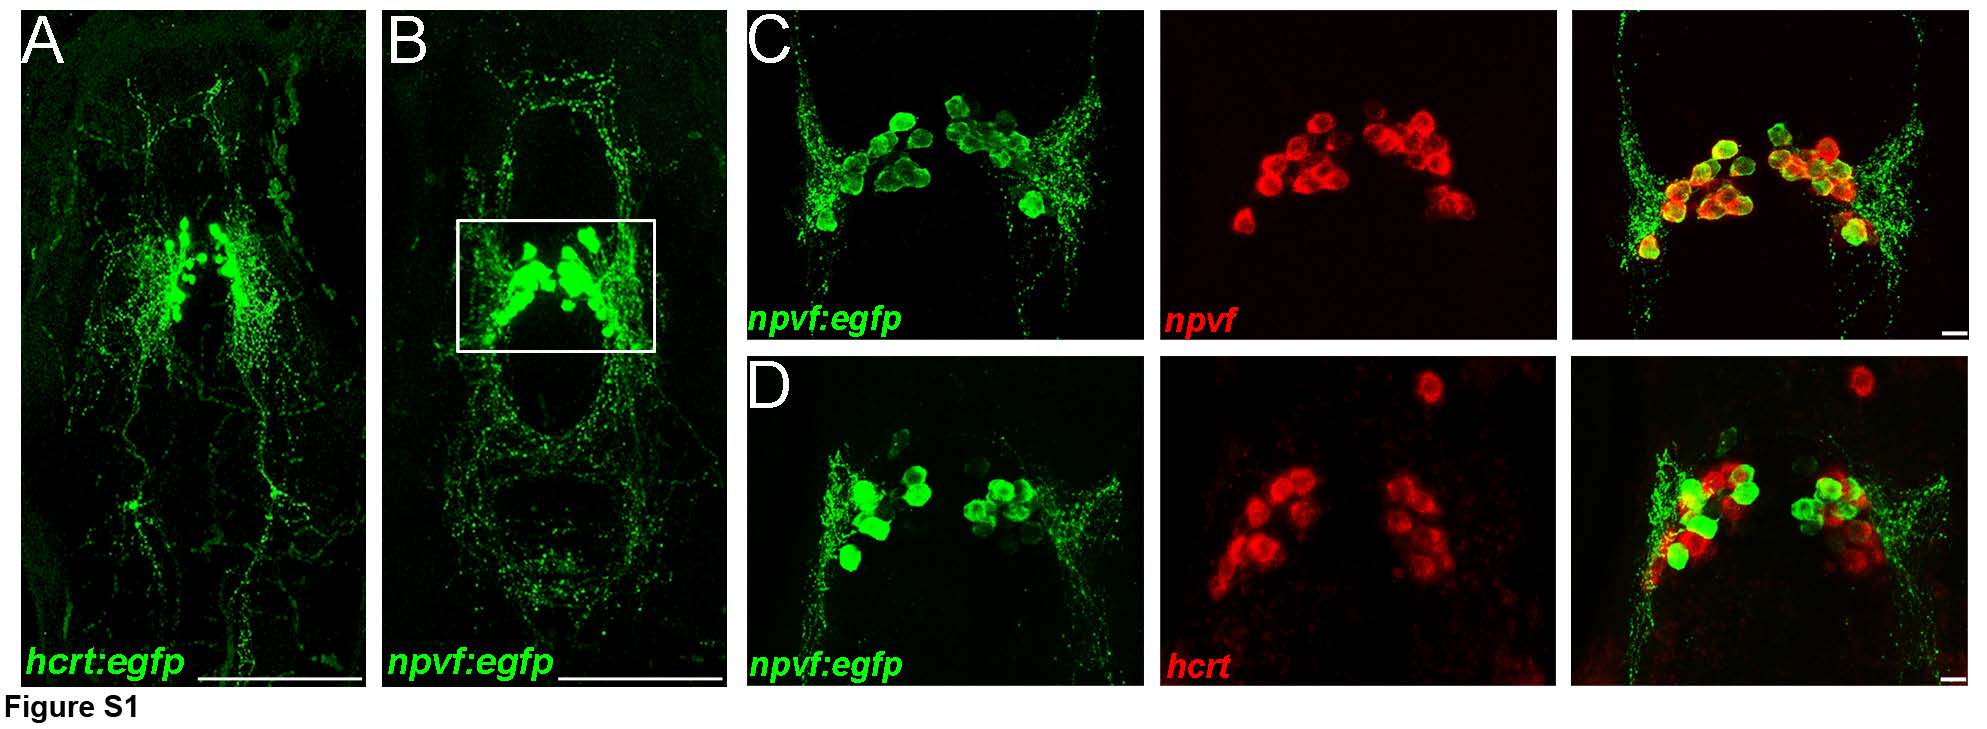
Co-expression of npvf but not hcrt in Tg(npvf:eGFP) larval zebrafish
A) Confocal Z-projection of Tg(npvf:EGFP) larval fish at 5 dpf. B) Confocal Z-projection of Tg(hcrt:EGFP) larval fish at 5 dpf. C) Confocal z-projection from Tg(npvf:EGFP) and npvf in situ hybridization showing colocalization. D) Confocal z-projection from Tg(npvf:EGFP) and hcrt in situ hybridization showing that Npvf+ neurons are not expressing hcrt. Scale bars: 100 μm (A, B) or 10 μm (C, D)
Figure Data
Acknowledgments
This image is the copyrighted work of the attributed author or publisher, and
ZFIN has permission only to display this image to its users.
Additional permissions should be obtained from the applicable author or publisher of the image.
Full text @ Sci. Rep.