
- Title
-
Phase variance optical coherence microscopy for label-free imaging of the developing vasculature in zebrafish embryos
- Authors
- Chen, Y., Trinh, L.A., Fingler, J., Fraser, S.E.
- Source
- Full text @ J. Biomed. Opt.
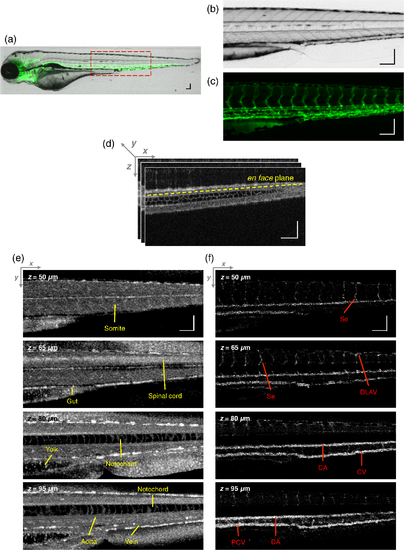
Structural and vascular imaging of zebrafish embryos. (a) Composite wide-field microscopic image of a 3--dpf zebrafish embryo: Tg(kdrl:eGFP). The red dashed box marks the trunk area of interest for SD-OCM imaging. (b) Bright-field microscopic image of the structure of a 3-dpf zebrafish trunk. (c) Fluorescence microscopic image of the GFP-labeled vascular endothelium in the trunk. (d) OCM B-scan intensity images at roughly the same area. The yellow dashed line represents one example plane for creating an en face image. (e) En face OCM intensity images at various depth layers. (f) En face pvOCM images of the vasculature at various depth layers. In both (e) and (f), each en face image was created from average intensity projection of 5-μm depth and spanned an area of 1.20×0.45 mm2. The depth z was relative to the top surface of the zebrafish trunk. Scale bars: 100 μm. |
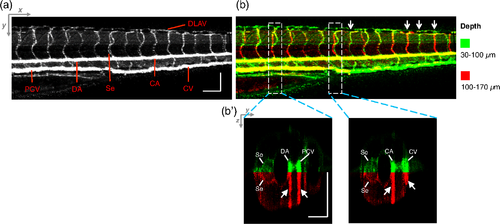
Visualization of the microvascular network by pvOCM. (a) Projection pvOCM image, created by average intensity projection over the depth range of 30 to 170 μm below the top surface of the zebrafish trunk. (b) Depth color-coded projection pvOCM image, with green denoting the vasculature on the ipsilateral half and red denoting the vasculature on the contralateral half of the embryo. (b’) Sagittal views of pvOCM images are shown for two white dashed box areas in (b). White arrows mark projection artifacts below strong flow regions of the aorta and vein. Scale bars: 100 μm. |
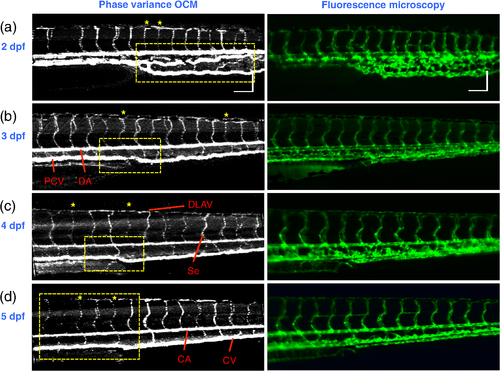
pvOCM images of the developing vascular system. Projection pvOCM images of zebrafish embryos at developmental stages of (a) 2 dpf, (b) 3 dpf, (c) 4 dpf, and (d) 5 dpf. All images were created by average intensity projection over entire depths across samples. Corresponding fluorescence microscopic images are shown on the right column for comparison. Yellow dashed boxes represent areas for analysis in Fig. 8. Scale bars: 100 μm. |
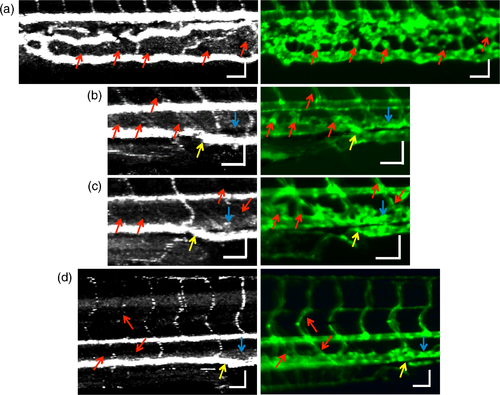
Enlarged views of pvOCM images of developing zebrafish embryos, corresponding to yellow dashed box areas in (a–d) of Fig. 7. Red arrows highlight some parts of the vasculature that appear in fluorescent images but are absent in pvOCM images. The absence of phase variance signals is related to the pulsatile nature of blood flow. Blue arrows highlight veins that had no blood flow detected after vascular junctions that are denoted by yellow arrows. Scale bars: 50 μm. |
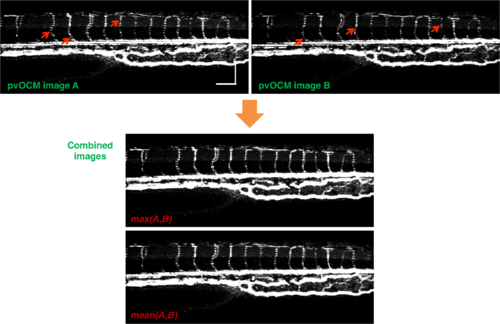
Combination of two pvOCM images of a 2-dpf zebrafish embryo acquired sequentially over the same area, separated in time by ∼90 s. Red arrows mark locations of the phase variance contrast appearing in one image but not the other. The combined image was generated by choosing either the maximum or the mean value for each corresponding pixel in these two images. Scale bars: 100 μm. |

Suppression of projection artifacts in (a) the sagittal view of the pvOCM image of a 3-dpf zebrafish embryo, using methods of (b) slab-subtraction algorithm, (c) step-down exponential filtering, and (d) projection-resolved algorithm. Yellow arrows mark projection artifacts beneath flow regions of DA and PCV. Blue arrows mark underrepresented weaker signals from the far side of vessels. Yellow dashed boxes denote a region of phase variance noise. Scale bars: 100 μm. |