
Image
|
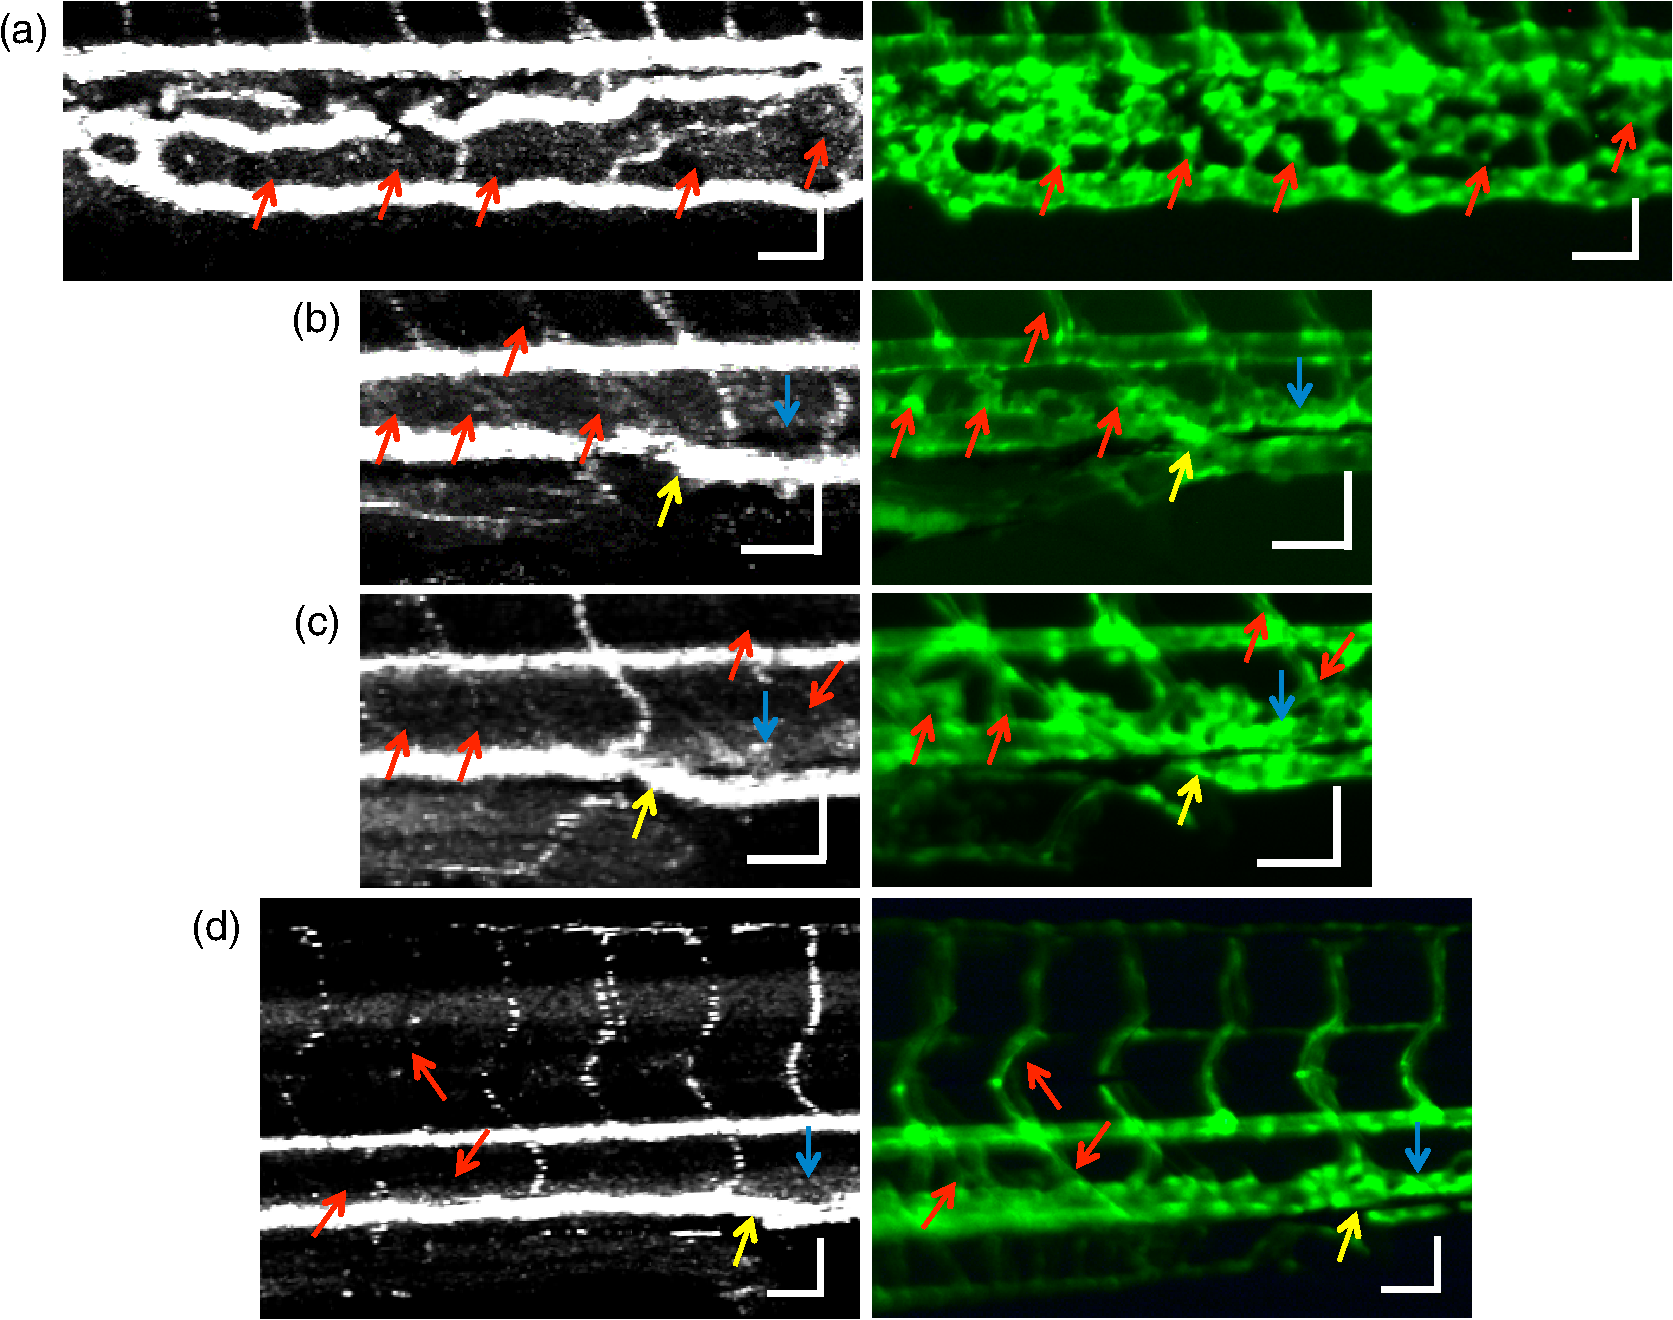
Figure Caption
Fig. 8
Enlarged views of pvOCM images of developing zebrafish embryos, corresponding to yellow dashed box areas in (a–d) of Fig. 7. Red arrows highlight some parts of the vasculature that appear in fluorescent images but are absent in pvOCM images. The absence of phase variance signals is related to the pulsatile nature of blood flow. Blue arrows highlight veins that had no blood flow detected after vascular junctions that are denoted by yellow arrows. Scale bars: 50 μm.
Acknowledgments
This image is the copyrighted work of the attributed author or publisher, and
ZFIN has permission only to display this image to its users.
Additional permissions should be obtained from the applicable author or publisher of the image.
Full text @ J. Biomed. Opt.