
Image
|
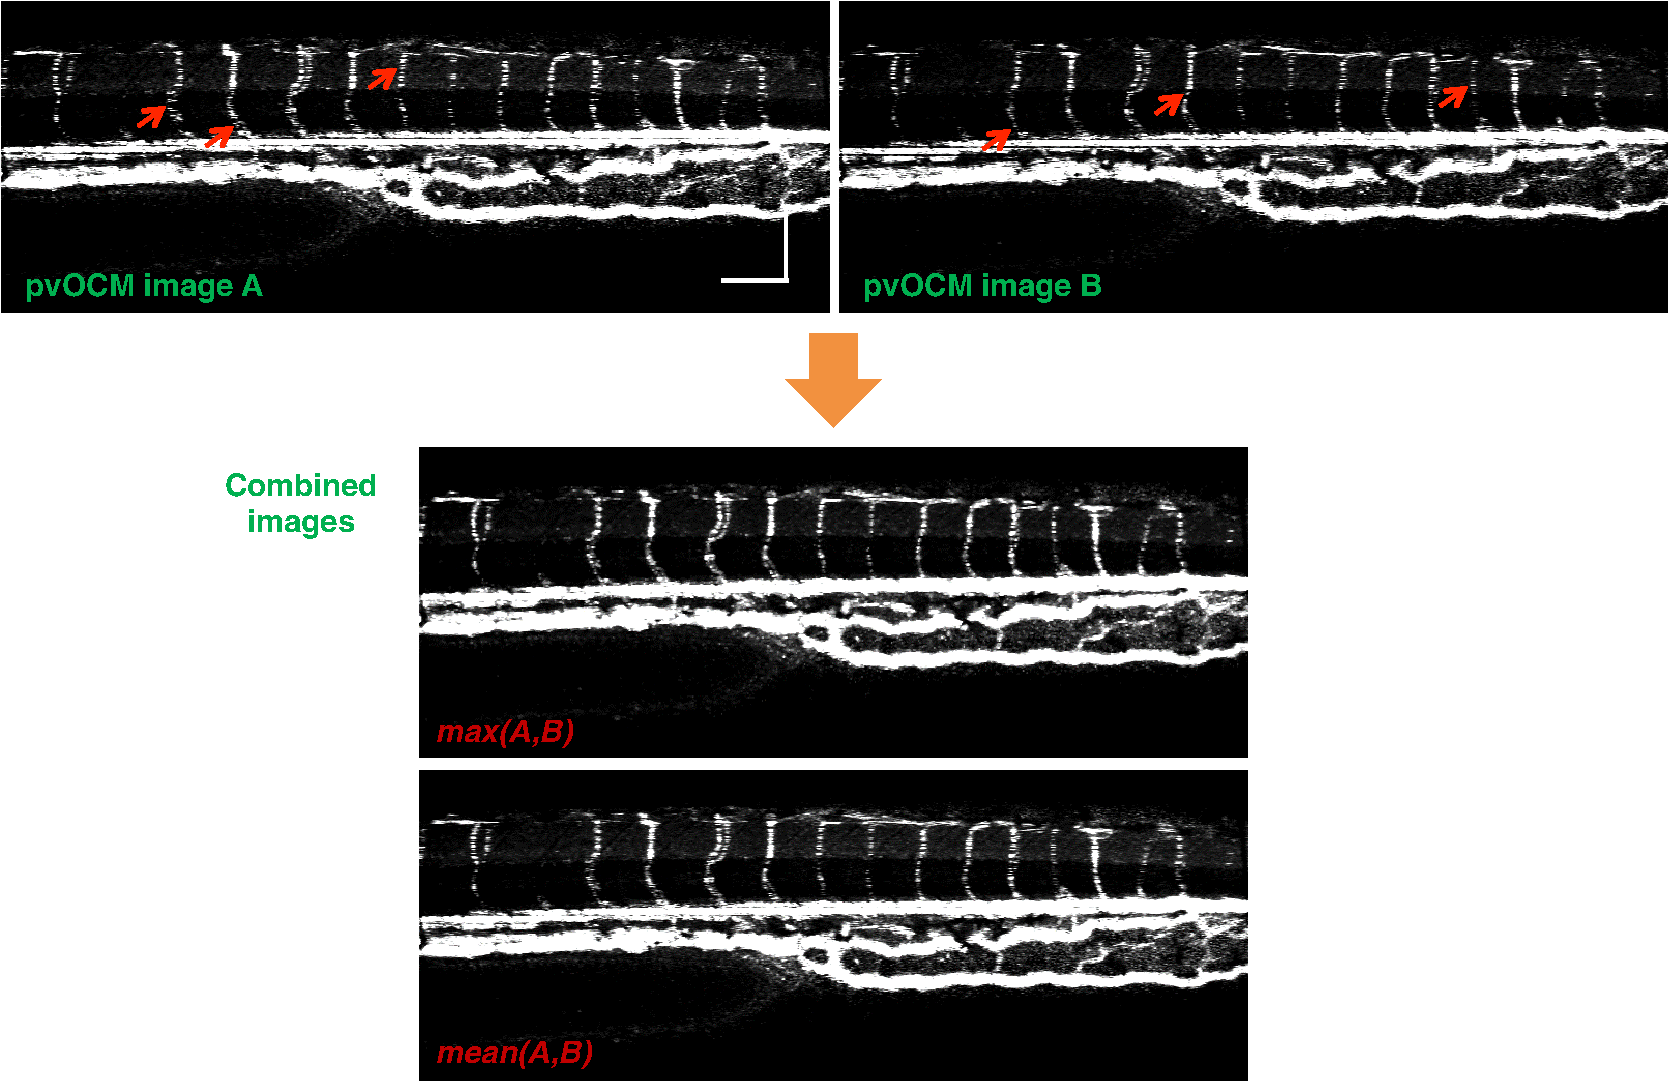
Figure Caption
Fig. 9
Combination of two pvOCM images of a 2-dpf zebrafish embryo acquired sequentially over the same area, separated in time by ∼90 s. Red arrows mark locations of the phase variance contrast appearing in one image but not the other. The combined image was generated by choosing either the maximum or the mean value for each corresponding pixel in these two images. Scale bars: 100 μm.
Acknowledgments
This image is the copyrighted work of the attributed author or publisher, and
ZFIN has permission only to display this image to its users.
Additional permissions should be obtained from the applicable author or publisher of the image.
Full text @ J. Biomed. Opt.