
- Title
-
A Zebrafish Live Imaging Model Reveals Differential Responses of Microglia Toward Glioblastoma Cells In Vivo
- Authors
- Hamilton, L., Astell, K.R., Velikova, G., Sieger, D.
- Source
- Full text @ Zebrafish
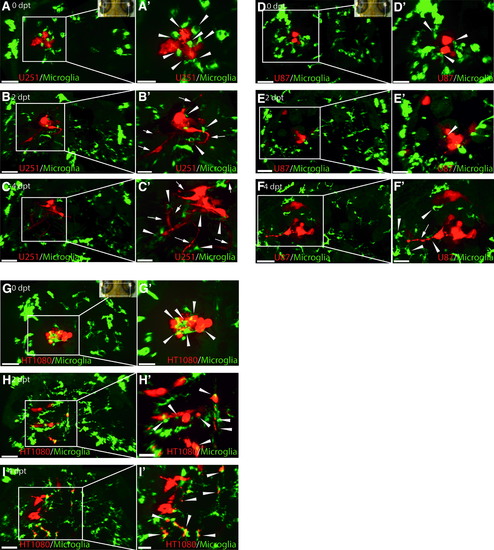
U251, U87, and HT1080 cells exhibit different growth patterns in the zebrafish optic tectum and stimulate an intensive microglia response. Representative confocal images of the optic tectum of mpeg1:EGFP zebrafish transplanted with U251mCherry (U251) glioblastoma cells, U87mCherry (U87) glioblastoma cells, and HT1080mCherry (HT1080) fibrosarcoma cells at 3 dpf. (A–C) Images from top to bottom are in chronological order showing 0, 2, and 4 dpt of U251 cells; (A′–C′) Higher magnification of regions of interest in (A–C) to highlight interactions of microglia (green) and U251 cells (red). U251 cellular projections are marked with a white arrow. Microglia interacting with U251 cells are marked with a white arrowhead. (D–F) Images from top to bottom are in chronological order showing 0, 2, and 4 dpt of U87 cells; (D′–F′) Higher magnification of regions of interest in (D–F) to highlight interactions of microglia (green) and U87 cells (red). U87 cellular projections are marked with a white arrow. Microglia interacting with U87 cells are marked with a white arrowhead. (G–I) Images from top to bottom are in chronological order showing 0, 2, and 4 dpt of HT1080 cells; (G′–I′) Higher magnification of regions of interest (G–I) to highlight interactions of microglia (green) and HT1080 cells (red). Microglia interacting with HT1080 cells are marked with a white arrowhead. Scale bars for (A–I): 50 μm. Scale bars for (A′–I′): 30 μm. All images represent maximum intensity projections of confocal stacks. Images were captured using an Andor spinning disk confocal microscope with a 20 × /NA 0.75 objective. Insets in (A, G, and D) show the orientation of samples (anterior to the top) and the region imaged (white rectangle). dpf, days postfertilization; dpt, days posttransplantation EXPRESSION / LABELING:
|
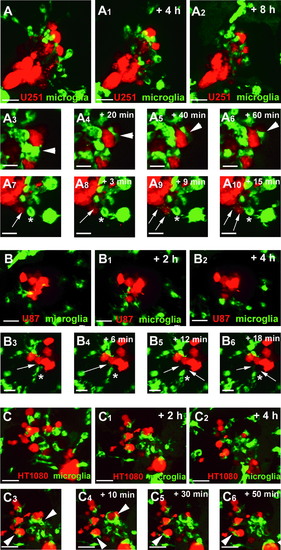
Microglia interact differently with U251, U87, and HT1080 cells. (A) Confocal time series showing microglia (green) responding to U251 cells (red) in the zebrafish optic tectum (recording times indicated; see also Supplementary Movie S1). (A3–A6) Time series highlighting a microglial cell closely interacting with a U251 cell for more than 60 min. White arrowhead marks the microglial cell interacting with the U251 cell. (A7–A10) Time series highlighting a microglial cell constantly sending and retracting processes toward U251 cells. White asterisk marks a microglial cell sending and retracting processes. White arrows mark microglial processes toward U251 cells. Scale bars for (A–A2): 30 μm. Scale bars for (A3–A10): 15 μm. (B) Confocal time series showing microglia (green) responding to U87 cells (red) in the zebrafish optic tectum (recording times indicated; see also Supplementary Movie S2). (B3–B6) Time series highlighting a microglial cell closely interacting with U87 cells. White asterisk marks a microglial cell sending and retracting processes. White arrows mark microglial processes toward U87 cells. Scale bars for (B–B2): 30 μm. Scale bars for (B3–B6): 20 μm. (C) Confocal time series showing microglia (green) responding to HT1080 cells (red) in the zebrafish optic tectum (recording times indicated; see also Supplementary Movie S3). (C3–C6) Time series highlighting microglia engulfing and phagocytosing HT1080 cells. Arrowheads indicate microglia engulfing and phagocytosing HT1080 cells. Scale bars for (C–C6): 30 μm. All images represent maximum intensity projections of confocal stacks. Images were captured using an Andor spinning disk confocal microscope with a 20 × /NA 0.75 objective. EXPRESSION / LABELING:
|
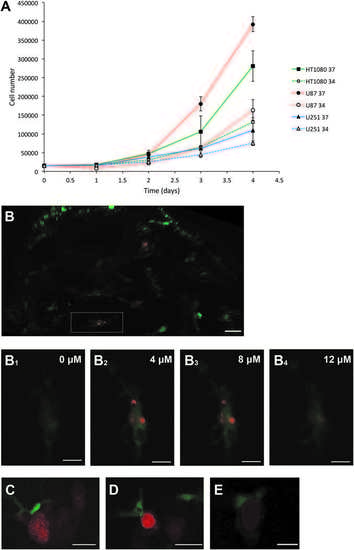
In vitro growth of U251, U87, and HT1080 cells and microglial interactions upon cell transplantation. (A) The growth rates of HT1080 mCherry, U87 mCherry, and U251 mCherry cells at 34C compared to 37C over a 4-day period. The experiment was repeated in triplicate, and the average cell numbers, from the three experiments, are plotted. (B) Representative confocal image of the optic tectum of mpeg1:EGFP zebrafish at 3 dpt with HT1080mCherry fibrosarcoma cells. Image represents a maximum intensity projection of a confocal stack. White rectangle encompasses the microglial cell that is shown in (B1–B4). (B1–B4) Single confocal z sections showing HT1080 cell fragments (red) engulfed by microglia (green). Confocal z sections are in a distance of 4 lm from each other. Images were captured using an Andor spinning disk confocal microscope with a 20 · /NA 0.75 objective. Scale bar for (B): 30lm, scale bar for (B1–B4): 8lm. (C) Single confocal z section showing a microglial cell (green) directly interacting with a U251 cell (red). Scale bar 15 lm. (D) Single confocal z section showing amicroglial cell (green) directly interacting with aU87 cell (red). Scale bar 20 lm. (E) Single confocal z section showing a microglial cell (green) directly interacting with a HT1080 cell (red). Scale bar 10 lm. (C–E) Images were captured using an Andor spinning disk confocal microscope with a 20 · /NA 0.75 objective. |
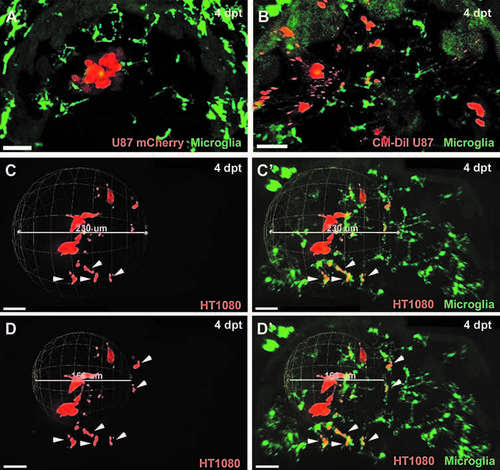
Prerequirements to measure invasiveness precisely: fluorescent protein expression in transplanted cells and microglia labelling. CM-DiI Dye labelled cells showed false positive rates of invasiveness due to detection of small fluorescent particles that might be either pure dye aggregates or vesicles released by tumor cells. (A) Confocal image of the optic tectum of mpeg1:EGFP zebrafish transplanted with U87 glioblastoma cells stably expressing the mCherry fluorescent protein (4 dpt). (B) Confocal image of the optic tectum of mpeg1:EGFP zebrafish transplanted with CM-DiI Dye labeled U87 glioblastoma cells (4 dpt). Microglia need to be taken into account to exclude transplanted cells that are within phagosomes of microglia and, thus, not viable and not truly invasive. (C, D) Confocal images of the optic tectum of mpeg1:EGFP zebrafish transplanted with HT1080mCherry cells (4 dpt). (C', D') Confocal images of the optic tectum of mpeg1:EGFP zebrafish transplanted with HT1080mCherry cells (same images as C, D) showing the mpeg1:EGFP channel in addition. (C, C') Sphere measurement for invasiveness, including all HT1080mCHerry cells. (D, D') Sphere measurement for invasiveness excluding HT1080mCherry cells within microglia. HT1080 cells within microglia are marked with a white arrowhead. Scale bars for all images: 30 lm. All images represent maximum intensity projections of confocal stacks. Images were captured using an Andor spinning disk confocal microscope with a 20 · /NA 0.75 objective. |