
Fig. S1
- ID
- ZDB-FIG-161207-8
- Publication
- Hamilton et al., 2016 - A Zebrafish Live Imaging Model Reveals Differential Responses of Microglia Toward Glioblastoma Cells In Vivo
- Other Figures
- All Figure Page
- Back to All Figure Page
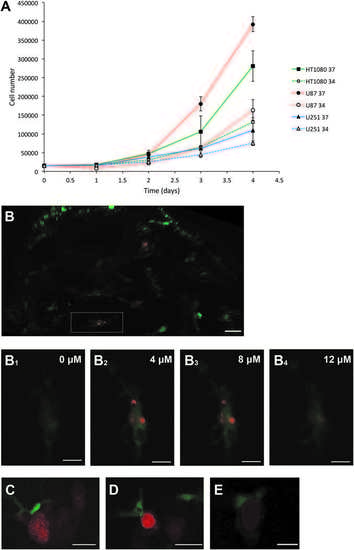
In vitro growth of U251, U87, and HT1080 cells and microglial interactions upon cell transplantation. (A) The growth rates of HT1080 mCherry, U87 mCherry, and U251 mCherry cells at 34C compared to 37C over a 4-day period. The experiment was repeated in triplicate, and the average cell numbers, from the three experiments, are plotted. (B) Representative confocal image of the optic tectum of mpeg1:EGFP zebrafish at 3 dpt with HT1080mCherry fibrosarcoma cells. Image represents a maximum intensity projection of a confocal stack. White rectangle encompasses the microglial cell that is shown in (B1–B4). (B1–B4) Single confocal z sections showing HT1080 cell fragments (red) engulfed by microglia (green). Confocal z sections are in a distance of 4 lm from each other. Images were captured using an Andor spinning disk confocal microscope with a 20 · /NA 0.75 objective. Scale bar for (B): 30lm, scale bar for (B1–B4): 8lm. (C) Single confocal z section showing a microglial cell (green) directly interacting with a U251 cell (red). Scale bar 15 lm. (D) Single confocal z section showing amicroglial cell (green) directly interacting with aU87 cell (red). Scale bar 20 lm. (E) Single confocal z section showing a microglial cell (green) directly interacting with a HT1080 cell (red). Scale bar 10 lm. (C–E) Images were captured using an Andor spinning disk confocal microscope with a 20 · /NA 0.75 objective. |