
- Title
-
Sustained Rhythmic Brain Activity Underlies Visual Motion Perception in Zebrafish
- Authors
- Pérez-Schuster, V., Kulkarni, A., Nouvian, M., Romano, S.A., Lygdas, K., Jouary, A., Dipoppa, M., Pietri, T., Haudrechy, M., Candat, V., Boulanger-Weill, J., Hakim, V., Sumbre, G.
- Source
- Full text @ Cell Rep.
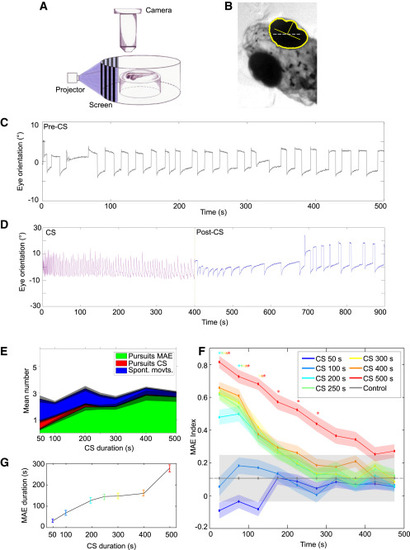
Zebrafish Larvae Perceive the MAE (A) Experimental setup. Stimuli were projected on a screen around the larva immobilized in agarose. The agarose was then removed around the eyes, and their rotations were recorded from above using an objective, a tube lens, and a video camera. (B) Detection of eye orientation. The original image was thresholded and converted to binary to detect the eyes. Yellow, the eye outline and the long and short axes of the fitted ellipse; gray dashed line, external axis. The orientation of the eyes was calculated with respect to the external horizontal axis. (C) Stereotypic spontaneous eye rotations in the absence of visual stimuli. Saccades in one direction are followed by a fixation period and a saccade in the opposite direction. (D) Eye rotations during CS and during the post-CS control period. Note the pursuit movements induced by the CS (magenta) and the pursuits in the opposite direction during the post-CS control period (blue), reminiscent of optokinetic MAE-like behavior. The latter gradually decreased in frequency until the stereotypical spontaneous eye movements were restored around 250 s. Mean eye velocity during the last 200 s of CS was 1.50°/s ± 0.03°/s, and eye velocity during optokinetic MAE-like behavior was 0.8°/s ± 0.03°/s (p = 1.6 × 10−54, Wilcoxon rank sum test). Eye amplitude during CS was 13.7° ± 0.2°, and eye amplitude during optokinetic MAE-like behavior was 7.0° ± 0.1° (p = 1.03 × 10⁻⁴, Wilcoxon rank sum test; n = 40 trials from 11 larvae for CS durations 500 s. (E) Ratio of the different types of movements during the first 50 s of the post-CS control period as a function of the CS duration (n = 36, 36, 39, 34, 36, 34, and 40 trials from 10, 9, 10, 10, 10, 9, and 11 larvae for CS durations of 50, 100, 200, 250, 300, 400, and 500 s, respectively). In all cases, the CS velocity was 26°/s. Green, pursuits in the MAE direction; red, pursuits in the CS direction; blue, spontaneous eye movements; gray shade, SE. (F) Mean MAE index as a function of time during the post-CS control period. The curves are color coded according to the CS durations (top right legend). The gray dash line represents the control index. The asterisk indicates significantly different from control (p < 0.01, Kruskal-Wallis), color coded according to the corresponding colors. Error bars, SE. (G) The average duration of optokinetic MAE-like behavior as a function of CS duration. The colors depict the duration of the CS as in (F). For (F) and (G), n = 120, 104, 117, 110, 114, 112, and 97 trials from 20, 19, 20, 19, 19, 19, and 17 larvae for CS durations of 50, 100, 200, 250, 300, 400, and 500 s, respectively. Control is n = 14 trials from 14 larvae. Error bars, SE. |
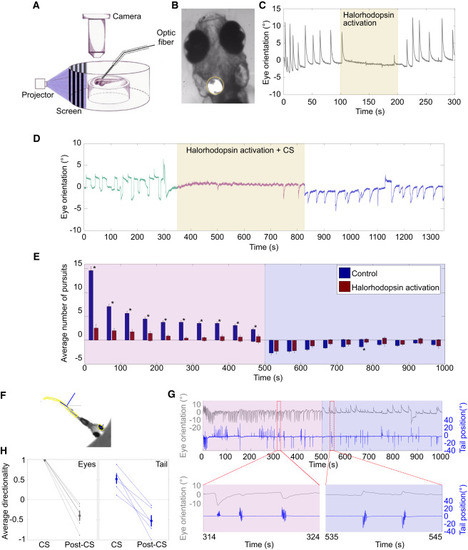
MAE Is Generated in a Sensory Brain Region (A) Experimental setup used to block eye movements during the presentation of MAE. Eye movements were recorded as in Figure 1A. To inhibit eye movements, we used transgenic larvae pan-neuronally expressing NpHR and a 105 μm optic fiber coupled to a 565 nm LED mounted on a micromanipulator. (B) Image of larva obtained using the setup in (A). In all experiments, the fiber was positioned orthogonally and unilaterally above rhombomere 5. The yellow circle shows the illuminated zone. (C) Example of optogenetic inhibition of OKR during the presentation of CS, with eye orientation as a function of time. The CS was presented during the entire 300 s period. The yellow patch represents the illumination period. Note the drastic and rapid inhibition of the eye movement upon halorhodopsin activation. (D) Example showing that optogenetic inhibition of eye movements during the presentation of CS did not perturb MAE; eye orientation as a function of time during CS. Green curve, pre-CS; pink curve, CS; blue curve, post-CS; yellow patch, NpHR activation period. (E) The average number of pursuits during the CS and the post-CS periods, summarizing all experiments as in (D). Pink background, CS period; violet background, post-CS control period; blue bars, control (LED off during CS); red bars, LED on during CS; positive values, pursuits in the direction of the CS; negative values, pursuits in the MAE direction. Asterisks mark significant differences (p < 0.01, Kruskal-Wallis; n = 9 trials from 9 larvae). Error bars, SE. (F) Detection of eye and tail orientation. The image of the larva superimposed with the automatic detection of the tail and eyes. The orientations were calculated with respect to the external horizontal axis (gray dashed lines). (G) Optomotor MAE-like behavior. Top: eye and tail orientations during CS (pink background) and post-CS (magenta background). Bottom: expanded timescale of the indicated regions above (red dashed rectangles). Note the inversion of the directionality of both eye and tail movements during the post-CS period with respect to the CS period. (H) Summary of all experiments as in (G). The average directionality of the eye pursuits (gray) and tail bouts (blue) during CS and post-CS periods (n = 6 trials from 6 larvae). To compute the directionality, we classified each pursuit and each tail bout as moving in the direction of the CS or in the opposite one. Movements performed in the direction of the CS were given the value 1, and movements in the opposite direction were given the value −1. For each experiment, we calculated the average across movements. Large gray dots represent the population average. Error bars, SE. For all experiments, average directionality of both eye pursuits and tail bouts was inverted. |

Ablation of the Optic Tectum Impairs the Generation of MAE (A) An optical plane of the HuC:GCaMP5 zebrafish tectum after two-photon laser ablation. For visualization purposes, ablation of a single tectal hemisphere is shown. For the experiments, both hemispheres were ablated. Note the large increase in fluorescence of the ablated neurons with respect to the intact hemisphere. (B) As in (A), but after labeling with acridine orange to label apoptotic neurons. The labeling was performed immediately after the behavioral experiments (1 day after the ablation). (C) Top: summary of the behavioral experiments after tectal ablations. The chart shows the average number of pursuits during the CS and the post-CS periods. Pink background, CS period; violet background, post-CS control period; blue bars, control (intact optic tectum); red bars, ablated optic tectum; positive values, pursuits in the direction of the CS; negative values, pursuits in the MAE direction. Asterisks mark significant differences (∗p < 0.05, ∗∗p < 0.01, Kruskal-Wallis; n = 26 trials from 4 larvae). Error bars, SE. Bottom: expanded timescale of the indicated regions above (green dashed lines). Note the weak initial behavioral response to the CS in ablated larvae and the much weaker optokinetic MAE-like behavior in ablated larvae compared to intact larvae. |

Frequency Analysis and Topography of MAE-Associated Neurons (A) Top: normalized power spectrum of eye movements during MAE-like behavior. Bottom: normalized power spectrum of neuronal data during MAE-like behavior. Violet, MAE direction-selective neurons; pink, CS direction-selective neurons; green, non-direction-selective neurons; yellow patches, significant behavioral frequencies (normalized power spectrum exceeds a threshold set at zero, dashed gray line). (B) Top: normalized averaged frequency power of behaviorally relevant significant frequencies, during post-CS control period. Gray lines, the individual experiments for the CS, MAE, and non-direction-selective neurons; black line, the mean power value. CS direction-selective modulation = −0.71 ± 0.13 dB, MAE direction-selective modulation = 0.15 ± 0.16 dB, and non-direction-selective modulation = −0.11 ± 0.14 dB (p = 4.1 × 10⁻⁵ for CS and MAE direction-selective neurons, p = 2.9 × 10⁻⁴ for non-direction-selective and MAE direction-selective neurons, p = 0.04 for CS and non-direction-selective neurons, Wilcoxon rank sum test). Bottom: as for top, but for non-significant non-behaviorally relevant frequencies. CS direction-selective modulation = −2.3 ± 0.7 dB, MAE direction-selective modulation = −1.96 ± 0.72 dB, and non-direction-selective modulation = −2.19 ± 0.75 dB (p = 0.34 for CS and MAE direction-selective neurons, p = 0.49 for non-direction-selective and MAE direction-selective neurons, p = 0.6 for CS and non-direction-selective neurons, Wilcoxon rank sum test). In both cases, error bars, SE. n = 9 trials from 8 larvae. (C) Pairwise correlation matrix of MAE direction-selective neuronal activity during the post-CS period. The matrix was ordered according to k-means clustering. The color-scale bar shows the level of correlation. (D) Top: raster plot of MAE direction-selective neurons during the post-CS control period ordered according to (A). Middle: sum of calcium activity. Bottom: eye orientation. About 30% of the neurons show synchronous Ca2+ transients associated with all eye pursuits in the MAE direction. (E) Topography of the MAE direction-selective neurons. Green, neurons correlated with the pursuits in the direction of MAE; red, non-correlated neurons. |

Calcium-imaging-data-processing methods and experimental protocols (related to Figure 4). (A) i. An optical section of the zebrafish larva’s optic tectum superimposed with the ROIs corresponding to each single neurons (yellow patches). ii. Examples of typical single-neuron DF/F traces (black) with significant fluorescence transients highlighted in red. Breaks in the traces depict discarded frames due to movement artifacts. (B) i. An optical section of the optic tectum of an ath5:GCaMP3 zebrafish larva, where the tectal neuropil can be clearly observed. The SROIs are superimposed to the image (yellow patches). ii. Examples of typical single-SROIs DF/F traces (black) with significant fluorescence transients highlighted in red. Breaks in the traces depict discarded frames due to movement artifacts. (C) Experimental setup: Scheme of the two-photon system for simultaneously monitoring eye movements and presenting visual stimuli. (D) MAE index as a function of time after CS under the two photon microscope. Blue curve: MAE index as a function of time under a two-photon microscope. CS consisted in repetitive moving bars for 500 s. Red curve: MAE index as a function of time as showed in Fig. 1F. CS consisted in whole field grating for 500 s. Gray line represents the control index for the two-photon experiments. Nonsignificant differences where found between the two conditions. Error bars: s.e. For repetitive moving bars, n=20 (trials), from 10 larvae. For whole field grating, n=15 (trials), from 15 larvae. (E) i. Experimental paradigm for monitoring adaptation of RGC projections in paralyzed larvae. ii. The sum of the relative change in fluorescence intensity (DF/F) of direction selective SROIs as a function of time. Top panel, CS direction selective SROIs. Bottom panel, MAE direction selective SROIs. The color bars represent the different stimulation blocks of the experimental paradigm: gray for pre-CS control, magenta for CS and blue post-CS control period. Top bars: depict the presentation period of each moving bar (gray: CS direction, yellow: MAE direction). (F) As in E, but for tectal neuron recordings. |