
Fig. 1
- ID
- ZDB-IMAGE-161122-8
- Publication
- Pérez-Schuster et al., 2016 - Sustained Rhythmic Brain Activity Underlies Visual Motion Perception in Zebrafish
- All Figures
- Figures for Pérez-Schuster et al., 2016
|
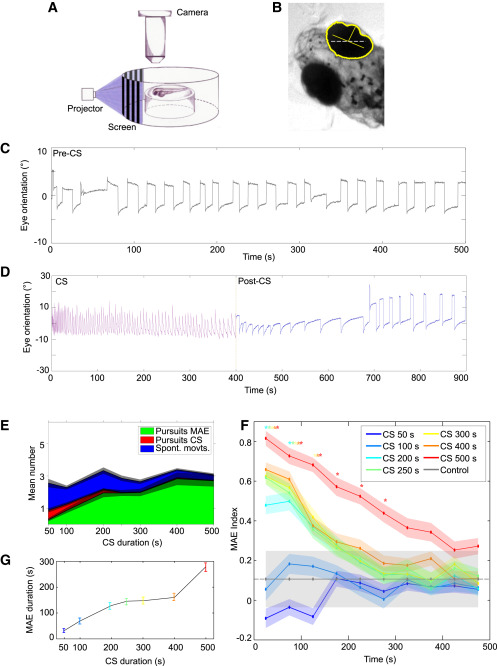
Fig. 1
Zebrafish Larvae Perceive the MAE
(A) Experimental setup. Stimuli were projected on a screen around the larva immobilized in agarose. The agarose was then removed around the eyes, and their rotations were recorded from above using an objective, a tube lens, and a video camera.
(B) Detection of eye orientation. The original image was thresholded and converted to binary to detect the eyes. Yellow, the eye outline and the long and short axes of the fitted ellipse; gray dashed line, external axis. The orientation of the eyes was calculated with respect to the external horizontal axis.
(C) Stereotypic spontaneous eye rotations in the absence of visual stimuli. Saccades in one direction are followed by a fixation period and a saccade in the opposite direction.
(D) Eye rotations during CS and during the post-CS control period. Note the pursuit movements induced by the CS (magenta) and the pursuits in the opposite direction during the post-CS control period (blue), reminiscent of optokinetic MAE-like behavior. The latter gradually decreased in frequency until the stereotypical spontaneous eye movements were restored around 250 s. Mean eye velocity during the last 200 s of CS was 1.50°/s ± 0.03°/s, and eye velocity during optokinetic MAE-like behavior was 0.8°/s ± 0.03°/s (p = 1.6 × 10−54, Wilcoxon rank sum test). Eye amplitude during CS was 13.7° ± 0.2°, and eye amplitude during optokinetic MAE-like behavior was 7.0° ± 0.1° (p = 1.03 × 10⁻⁴, Wilcoxon rank sum test; n = 40 trials from 11 larvae for CS durations 500 s.
(E) Ratio of the different types of movements during the first 50 s of the post-CS control period as a function of the CS duration (n = 36, 36, 39, 34, 36, 34, and 40 trials from 10, 9, 10, 10, 10, 9, and 11 larvae for CS durations of 50, 100, 200, 250, 300, 400, and 500 s, respectively). In all cases, the CS velocity was 26°/s. Green, pursuits in the MAE direction; red, pursuits in the CS direction; blue, spontaneous eye movements; gray shade, SE.
(F) Mean MAE index as a function of time during the post-CS control period. The curves are color coded according to the CS durations (top right legend). The gray dash line represents the control index. The asterisk indicates significantly different from control (p < 0.01, Kruskal-Wallis), color coded according to the corresponding colors. Error bars, SE.
(G) The average duration of optokinetic MAE-like behavior as a function of CS duration. The colors depict the duration of the CS as in (F). For (F) and (G), n = 120, 104, 117, 110, 114, 112, and 97 trials from 20, 19, 20, 19, 19, 19, and 17 larvae for CS durations of 50, 100, 200, 250, 300, 400, and 500 s, respectively. Control is n = 14 trials from 14 larvae. Error bars, SE.