
Fig. 2
- ID
- ZDB-IMAGE-161122-9
- Publication
- Pérez-Schuster et al., 2016 - Sustained Rhythmic Brain Activity Underlies Visual Motion Perception in Zebrafish
- All Figures
- Figures for Pérez-Schuster et al., 2016
|
Fig. 2
MAE Is Generated in a Sensory Brain Region
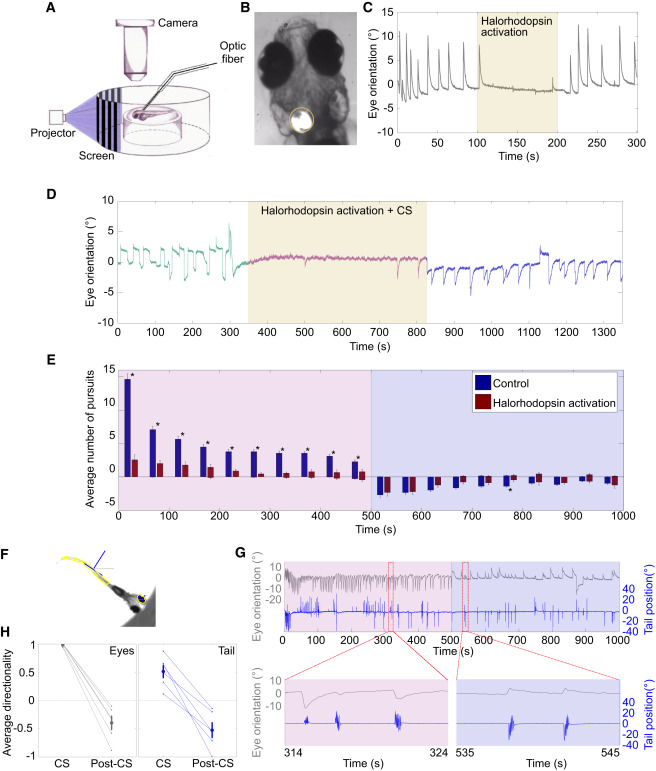
(A) Experimental setup used to block eye movements during the presentation of MAE. Eye movements were recorded as in Figure 1A. To inhibit eye movements, we used transgenic larvae pan-neuronally expressing NpHR and a 105 μm optic fiber coupled to a 565 nm LED mounted on a micromanipulator.
(B) Image of larva obtained using the setup in (A). In all experiments, the fiber was positioned orthogonally and unilaterally above rhombomere 5. The yellow circle shows the illuminated zone.
(C) Example of optogenetic inhibition of OKR during the presentation of CS, with eye orientation as a function of time. The CS was presented during the entire 300 s period. The yellow patch represents the illumination period. Note the drastic and rapid inhibition of the eye movement upon halorhodopsin activation.
(D) Example showing that optogenetic inhibition of eye movements during the presentation of CS did not perturb MAE; eye orientation as a function of time during CS. Green curve, pre-CS; pink curve, CS; blue curve, post-CS; yellow patch, NpHR activation period.
(E) The average number of pursuits during the CS and the post-CS periods, summarizing all experiments as in (D). Pink background, CS period; violet background, post-CS control period; blue bars, control (LED off during CS); red bars, LED on during CS; positive values, pursuits in the direction of the CS; negative values, pursuits in the MAE direction. Asterisks mark significant differences (p < 0.01, Kruskal-Wallis; n = 9 trials from 9 larvae). Error bars, SE.
(F) Detection of eye and tail orientation. The image of the larva superimposed with the automatic detection of the tail and eyes. The orientations were calculated with respect to the external horizontal axis (gray dashed lines).
(G) Optomotor MAE-like behavior. Top: eye and tail orientations during CS (pink background) and post-CS (magenta background). Bottom: expanded timescale of the indicated regions above (red dashed rectangles). Note the inversion of the directionality of both eye and tail movements during the post-CS period with respect to the CS period.
(H) Summary of all experiments as in (G). The average directionality of the eye pursuits (gray) and tail bouts (blue) during CS and post-CS periods (n = 6 trials from 6 larvae). To compute the directionality, we classified each pursuit and each tail bout as moving in the direction of the CS or in the opposite one. Movements performed in the direction of the CS were given the value 1, and movements in the opposite direction were given the value −1. For each experiment, we calculated the average across movements. Large gray dots represent the population average. Error bars, SE. For all experiments, average directionality of both eye pursuits and tail bouts was inverted.