
- Title
-
Two UV-Sensitive Photoreceptor Proteins, Opn5m and Opn5m2 in Ray-Finned Fish with Distinct Molecular Properties and Broad Distribution in the Retina and Brain
- Authors
- Sato, K., Yamashita, T., Haruki, Y., Ohuchi, H., Kinoshita, M., Shichida, Y.
- Source
- Full text @ PLoS One

In situ hybridization analysis of Opn5m and Opn5m2 mRNA in the retina of medaka fish, zebrafish, and spotted gar. A-D, Detection of medaka fish Opn5m in the retina. Frontal consecutive sections were hybridized with Opn5m antisense (A) and sense (B) probes. Enlarged views of the boxed areas, ventral and dorsal sides, in (A) are shown in (C) and (D), respectively. E-H, Detection of zebrafish Opn5m in the retina. Frontal consecutive sections were hybridized with Opn5m antisense (E) and sense (F) probes. Enlarged views of the boxed areas, ventral and dorsal sides, in (E) are shown in (G) and (H), respectively. I-L, Detection of zebrafish Opn5m2 within the retina. Frontal consecutive sections were hybridized with Opn5m antisense (I) and sense (J) probes. Enlarged views of the boxed areas, ventral and dorsal sides, in (I) are shown in (K) and (L), respectively. M-P, Detection of spotted gar Opn5m within the retina. Ventral regions were hybridized with Opn5m antisense (M) and sense (N) probes. Dorsal regions were hybridized with Opn5m antisense (O) and sense (P) probes. Q-T, Detection of spotted gar Opn5m2. Ventral regions were hybridized with Opn5m antisense (Q) and sense (R) probes. Dorsal regions were hybridized with Opn5m antisense (S) and sense (T) probes. All the sections shown in this figure were counterstained with Nuclear Fast Red. Scale bar: A, B, E, F, I, J, 200 µm; C, D, G, H, K, L, M-T 50 µm EXPRESSION / LABELING:
|
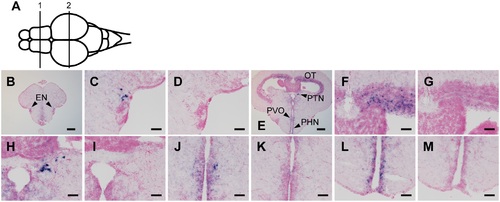
Distribution of Opn5m mRNA within zebrafish brain. A, Schematic drawing of zebrafish brain, dorsal view. Numbered lines indicate the positions of cross sections shown in B-M. B-M, Localization of zebrafish Opn5m within the brain. Expression signals were detected within frontal sections cut along lines 1 (B), and 2 (E). Sections were hybridized with Opn5m antisense (B, C, E, F, H, J, L) and sense (D, G, I, K, M) probes. Enlarged views of regions around entopeduncular nucleus in panel B, optic tectum, pretectal nucleus, paraventricular organ, and periventricular nucleus in panel E are shown in panels C, F, H, J, and K, respectively. Panels D, G, I, K, and M show consecutive tissue sections to C, F, and I hybridized with Opn5m sense probe, respectively. We could not detect any hybridization signals for Opn5m2 in the zebrafish brain. All sections shown in this figure were counterstained with Nuclear Fast Red. Scale bar: B, E, 200 µm; C, D, F-M, 50 µm. EXPRESSION / LABELING:
|
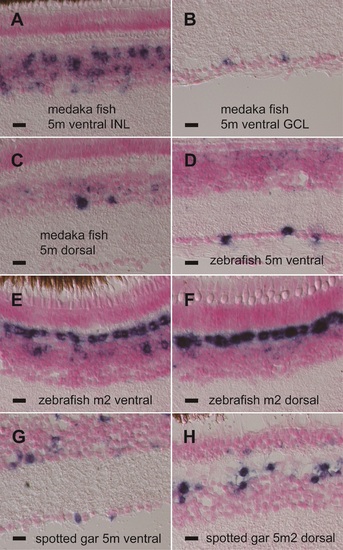
High-power field microscopic images of in situ hybridization in fish retinas (600x magnification). (A) Medaka fish Opn5m in the INL of the ventral retina. (B) Medaka fish Opn5m in the GCL of the ventral retina. (C) Medaka fish Opn5m in the dorsal retina. (D) Zebrafish Opn5m in the ventral retina. (E) Zebrafish Opn5m2 in the ventral retina. (F) Zebrafish Opn5m2 in the dorsal retina. (G) Spotted gar Opn5m in the ventral retina. (H) Spotted gar Opn5m2 in the dorsal retina. Scale bar: 10 µm. EXPRESSION / LABELING:
|
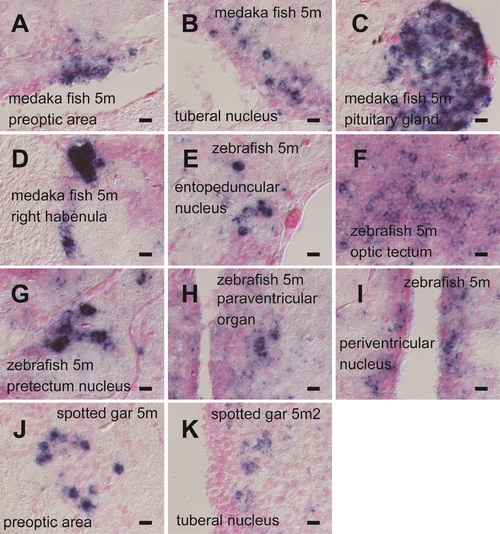
High-power field microscopic images of in situ hybridization in fish brains (600x magnification). (A) Medaka fish Opn5m in preoptic area. (B) Medaka fish Opn5m in tuberal nucleus. (C) Medaka fish Opn5m in pituitary gland. (D) Medaka fish Opn5m in right habenula. (E) Zebrafish Opn5m in entopeduncular nucleus. (F) Zebrafish Opn5m in optic tectum. (G) Zebrafish Opn5m in pretectal nucleus. (H) Zebrafish Opn5m in paraventricular organ. (I) Zebrafish Opn5m in periventricular nucleus. (J) Spotted gar Opn5m in preoptic area. (K) Spotted gar Opn5m2 in tuberal nucleus. Scale bar: 10 µm. EXPRESSION / LABELING:
|