
Fig. 4
- ID
- ZDB-IMAGE-160531-2
- Genes
- Publication
- Sato et al., 2016 - Two UV-Sensitive Photoreceptor Proteins, Opn5m and Opn5m2 in Ray-Finned Fish with Distinct Molecular Properties and Broad Distribution in the Retina and Brain
- All Figures
- Figures for Sato et al., 2016
|
Fig. 4
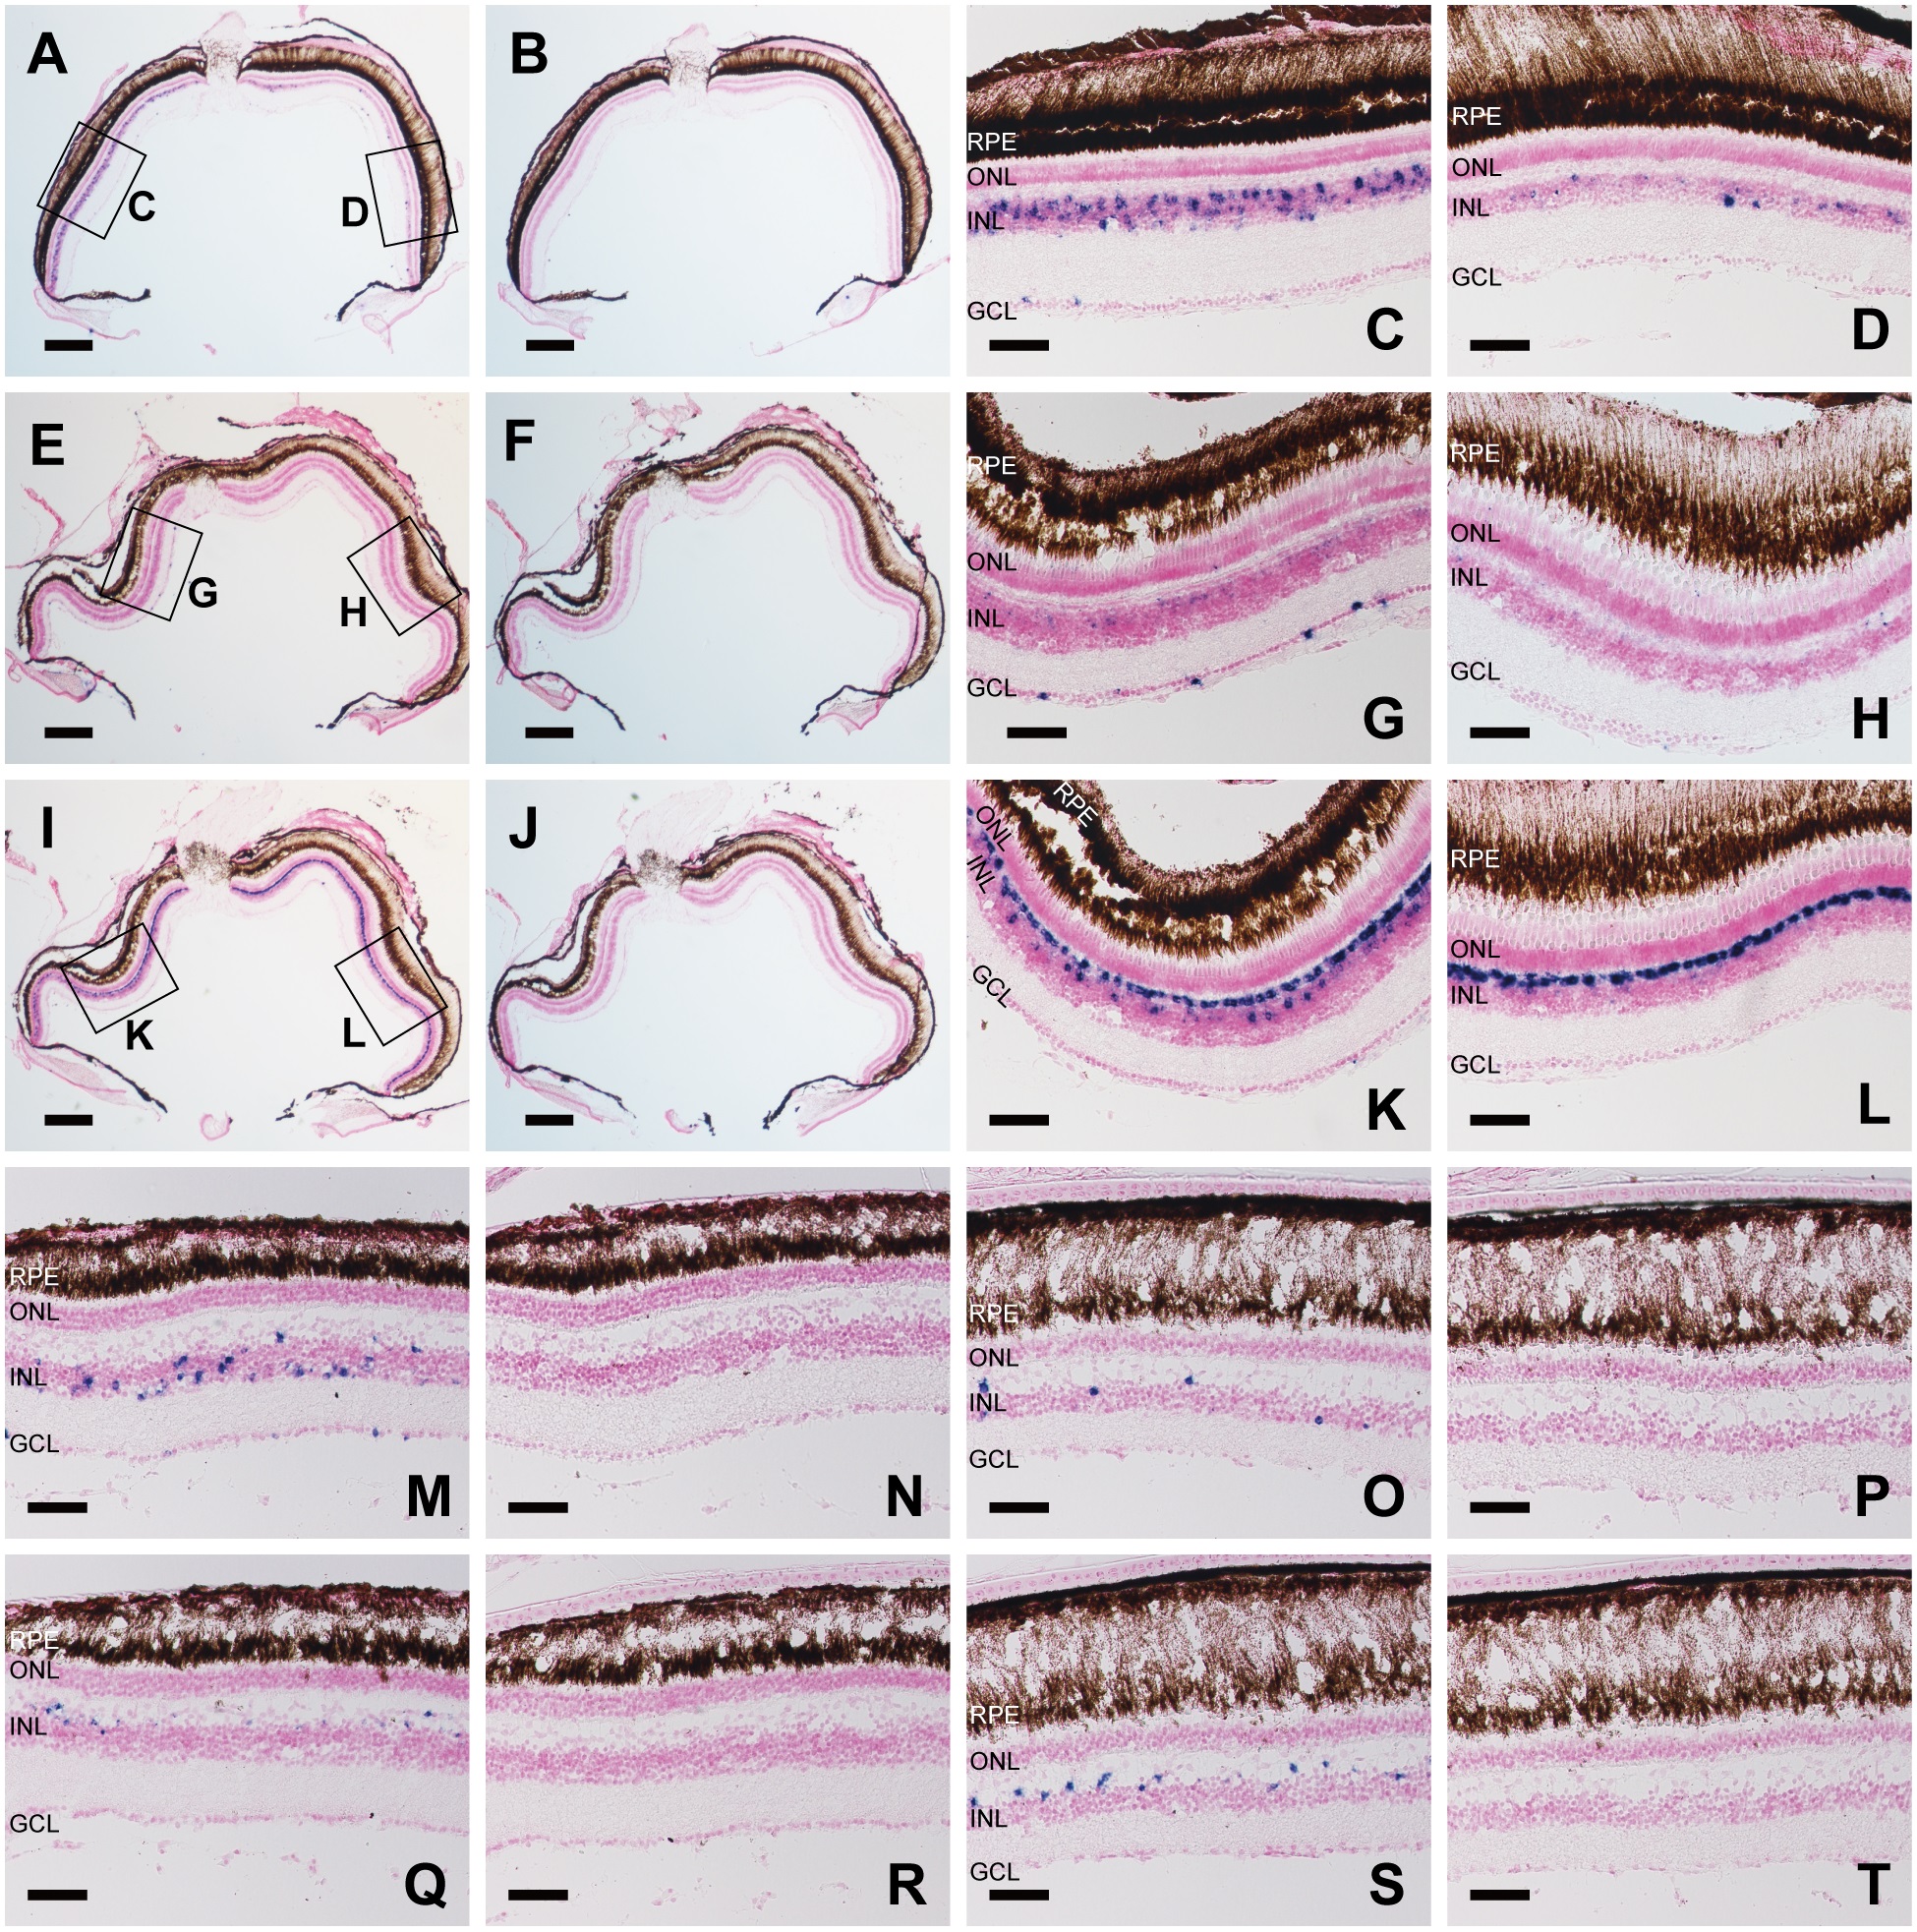
In situ hybridization analysis of Opn5m and Opn5m2 mRNA in the retina of medaka fish, zebrafish, and spotted gar.
A-D, Detection of medaka fish Opn5m in the retina. Frontal consecutive sections were hybridized with Opn5m antisense (A) and sense (B) probes. Enlarged views of the boxed areas, ventral and dorsal sides, in (A) are shown in (C) and (D), respectively. E-H, Detection of zebrafish Opn5m in the retina. Frontal consecutive sections were hybridized with Opn5m antisense (E) and sense (F) probes. Enlarged views of the boxed areas, ventral and dorsal sides, in (E) are shown in (G) and (H), respectively. I-L, Detection of zebrafish Opn5m2 within the retina. Frontal consecutive sections were hybridized with Opn5m antisense (I) and sense (J) probes. Enlarged views of the boxed areas, ventral and dorsal sides, in (I) are shown in (K) and (L), respectively. M-P, Detection of spotted gar Opn5m within the retina. Ventral regions were hybridized with Opn5m antisense (M) and sense (N) probes. Dorsal regions were hybridized with Opn5m antisense (O) and sense (P) probes. Q-T, Detection of spotted gar Opn5m2. Ventral regions were hybridized with Opn5m antisense (Q) and sense (R) probes. Dorsal regions were hybridized with Opn5m antisense (S) and sense (T) probes. All the sections shown in this figure were counterstained with Nuclear Fast Red. Scale bar: A, B, E, F, I, J, 200 µm; C, D, G, H, K, L, M-T 50 µm