
Fig. 6
- ID
- ZDB-IMAGE-160531-3
- Genes
- Publication
- Sato et al., 2016 - Two UV-Sensitive Photoreceptor Proteins, Opn5m and Opn5m2 in Ray-Finned Fish with Distinct Molecular Properties and Broad Distribution in the Retina and Brain
- All Figures
- Figures for Sato et al., 2016
|
Fig. 6
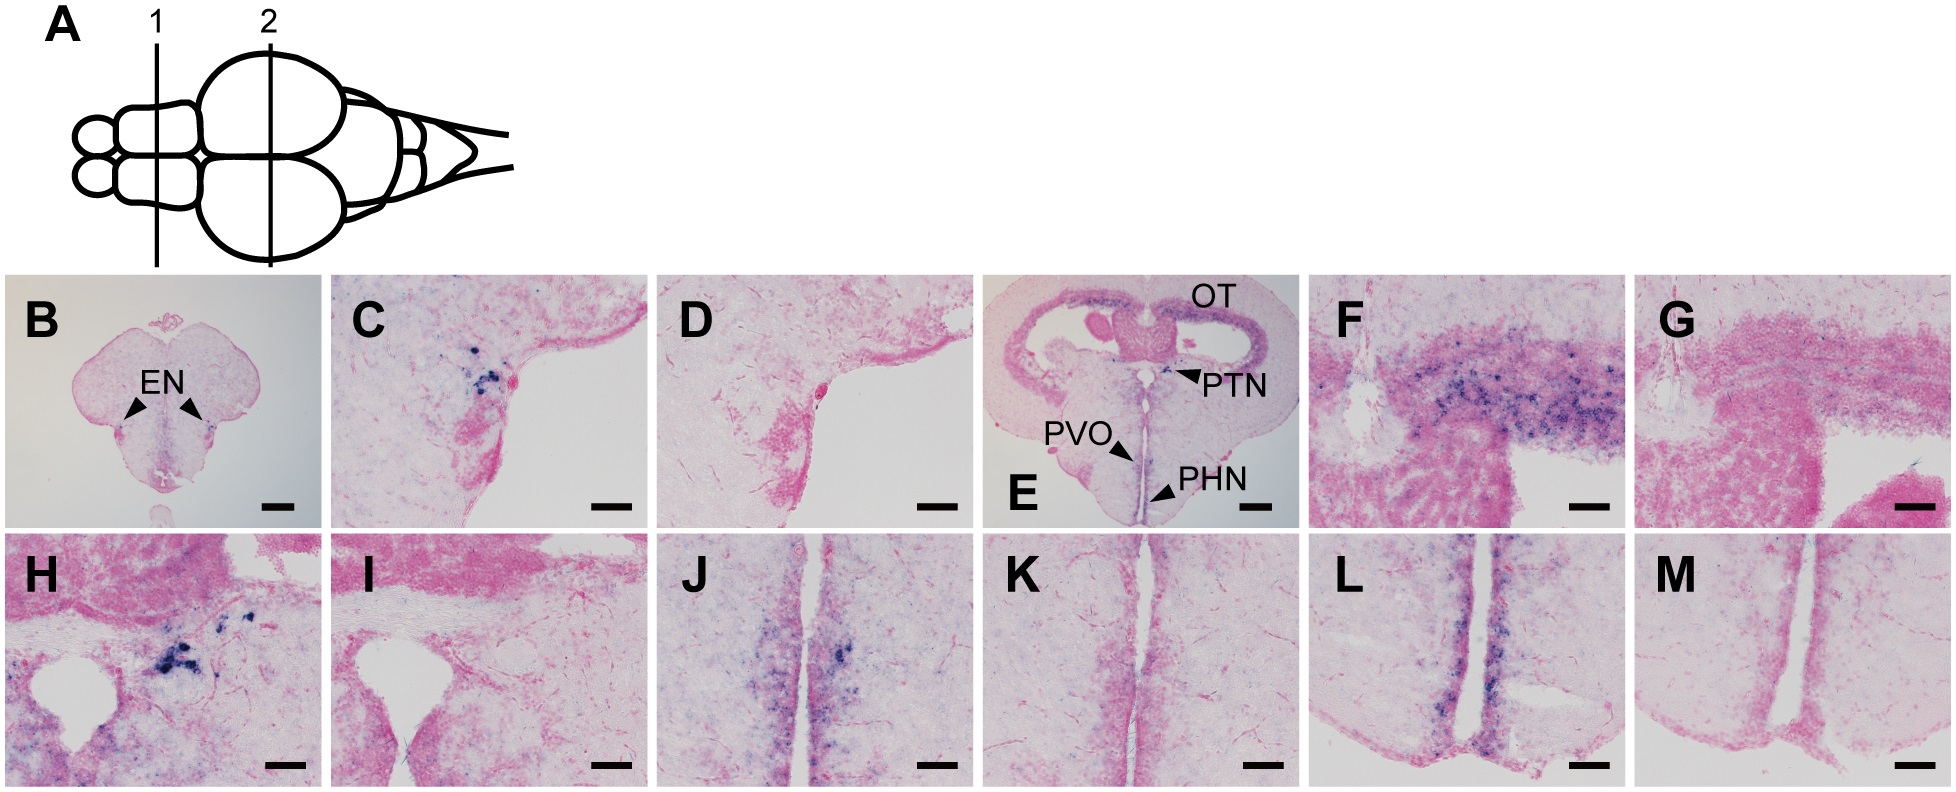
Distribution of Opn5m mRNA within zebrafish brain.
A, Schematic drawing of zebrafish brain, dorsal view. Numbered lines indicate the positions of cross sections shown in B-M. B-M, Localization of zebrafish Opn5m within the brain. Expression signals were detected within frontal sections cut along lines 1 (B), and 2 (E). Sections were hybridized with Opn5m antisense (B, C, E, F, H, J, L) and sense (D, G, I, K, M) probes. Enlarged views of regions around entopeduncular nucleus in panel B, optic tectum, pretectal nucleus, paraventricular organ, and periventricular nucleus in panel E are shown in panels C, F, H, J, and K, respectively. Panels D, G, I, K, and M show consecutive tissue sections to C, F, and I hybridized with Opn5m sense probe, respectively. We could not detect any hybridization signals for Opn5m2 in the zebrafish brain. All sections shown in this figure were counterstained with Nuclear Fast Red. Scale bar: B, E, 200 µm; C, D, F-M, 50 µm.