
- Title
-
Noise modulation in retinoic acid signaling sharpens segmental boundaries of gene expression in the embryonic zebrafish hindbrain
- Authors
- Sosnik, J., Zheng, L., Rackauckas, C.V., Digman, M., Gratton, E., Nie, Q., Schilling, T.F.
- Source
- Full text @ Elife
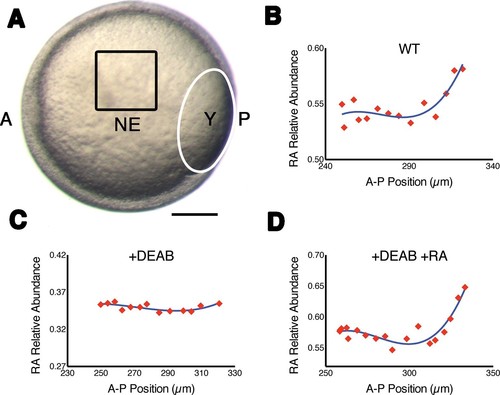
Measuring RA gradients in zebrafish embryos with Phasor-FLIM. (A) Example of a zebrafish embryo at mid-gastrula stage (8.5 hr post-fertilization) with the imaging area (black square – encompassing positions 230–330 in B-D) in the neural ectoderm (NE) centered ~200 μm from the advancing blastoderm margin (white line) (A: anterior, P: posterior, Y: yolk). Scale bar = 150 μm. (B-D) Plots of the relative abundance of RA (as the difference 1-dRA) versus position in μm along the A-P axis (anterior to the left) in WT (B), DEAB-treated (C), and DEAB-treated embryos co-treated with 0.7 nM exogenous RA (D). Solid curves in (B-D) represent best fit. |
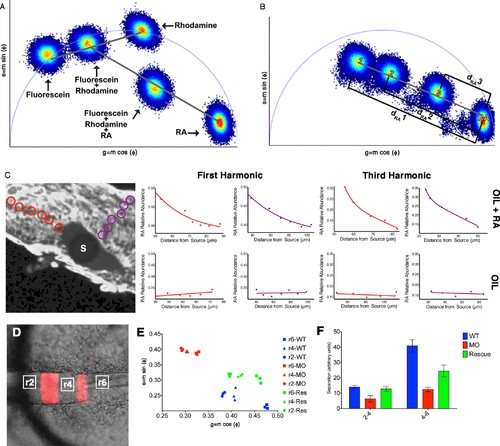
Phasor-FLIM detects relative levels of RA. (A) Schematic representation of how shifts in measurements displayed on the phasor plot reflect relative levels of each component in a complex mixture. Each plotted position is the weighted linear composition of the positions of all of the autofluorescent constituents (rhodamine, fluorescein and RA) of the mixture. (B) Graphic representation of the measured distance used to calculate the relative abundance of RA (1-dRA). The diameter of the phasor plot equals 1 and thus, the function 1-dRA can never reach zero (even in total absence of RA). (C) Fluorescence intensity image of a zebrafish embryo with an implanted, RA-infused oil droplet to create an ectopic source (S); scale bar = 50 um. Red and purple circles represent the positions measured and graphed for the oil + RA embryo (top row). The plots represent the relative abundance of RA (as the difference 1-dRA) with respect to distance from the source (lines represent best fit curves). Analysis of the RA distribution from an ectopic RA source at the 3rd harmonic, corresponding to measurements at the 1st harmonic, reveals that the observed differences are due to changes in the relative abundance of RA. Embryos injected with oil alone (bottom row) show no detectable differences in the distribution or RA with distance. Plots presented are representative figures from 6–12 embryos from each condition, with three independent datasets. (D) mCherry fluorescence in r3 and r5 combined with DIC in a living Tg(shhb:KalTA4,UAS-E1b:mCherry) transgenic zebrafish hindbrain (anterior to the left) used for FLIM measurements. White boxes represent areas assessed by FLIM in E and F. (E) Phasor plot showing typical FLIM signatures for these three areas in wildtype embryos (blue), embryos injected with Aldh1a2-MO (red) or injected with Aldh1a2-MO and subsequently rescued by transplanting WT paraxial mesoderm (green). The FLIM signatures in rhombomeres of MO-injected embryos lie further away from that of absolute RA, indicating reduced RA concentration. Transplanted WT mesoderm partially rescues the positions of FLIM-signatures for each rhombomere in the phasor plot. (F) Quantification of the distances of r2-r4 and r4-r6 in the phasor space. The separation of RA levels in these rhombomeres is significantly reduced in MO-injected embryos and rescued by transplanted WT mesoderm. |
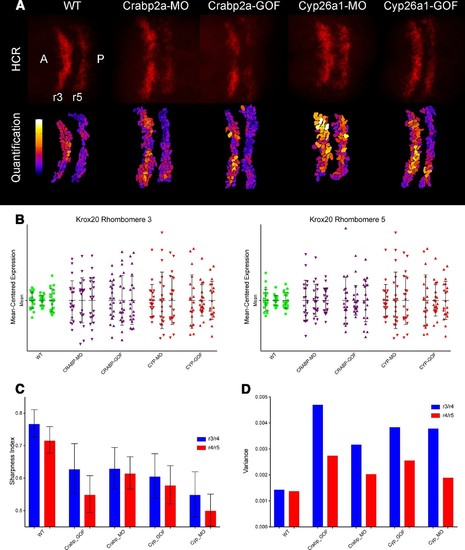
Both Crabp2a and Cyp26a1 attenuate noise in krox20 expression and facilitate rhombomere boundary sharpening. (A) Representative Z projections of r3 and r5 (dorsal views, anterior to the left) analyzed by hybridization chain reaction (HCR) for krox20 (r3, rhombomere 3; r5, rhombomere 5; A, anterior; P, posterior). We performed all HCR analyses on raw 3D data and later generated Z-projections and enhanced contrast to simplify presentation. Colors correspond to total krox20 RNA in each cell as measured by total fluorescence intensity bracketed for maximum and minimum for the 5 conditions and represented in a linear scale. (B) Mean-centered analysis of krox20 expression of a subset of cells for r3 and r5 from 3 randomly selected embryos for each condition. (C) Sharpness indices of the r3/r4 boundary (blue) and r4/r5 boundary (red) for embryos from each of the treatment conditions. Bars correspond to s.d. (D) Analysis of the variance in boundary sharpness from the quantification in (C). All perturbations yielded significant differences from wild-type controls, as noted in the Statistical Analysis. Therefore no asterisks were included to indicate columns representing statistical significance. |
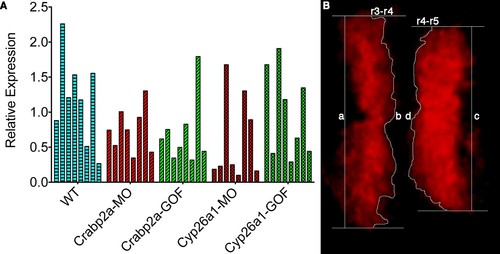
Single embryos show highly variable mean levels of krox20 expression and boundary sharpness. (A) Embryos were injected with mRNA coding for the membrane-bound GFP-CAAX and morpholinos (MO) against Crabp2a or Cyp26a1 or mRNA coding for Crabp2a-Myc or Cyp26a1-Myc or water (WT). Ef1α was used as the standard and a homogeneous collection of mRNA from 100 wildtype embryos was used as the reference for the △△Ct method. Experiments were run in triplicates and repeated 4 (four) times. (B) A sharpness index was calculated using the ratio between the measured length of the theoretical sharp boundary and the actual measured length of the boundary of krox20 expression, consistent with previous models (Zhang et al., 2012). In this example, sharpness of the r3-r4 boundary is the ratio of a/b and the index for the r4-r5 boundary is the ratio c/d. |