
|
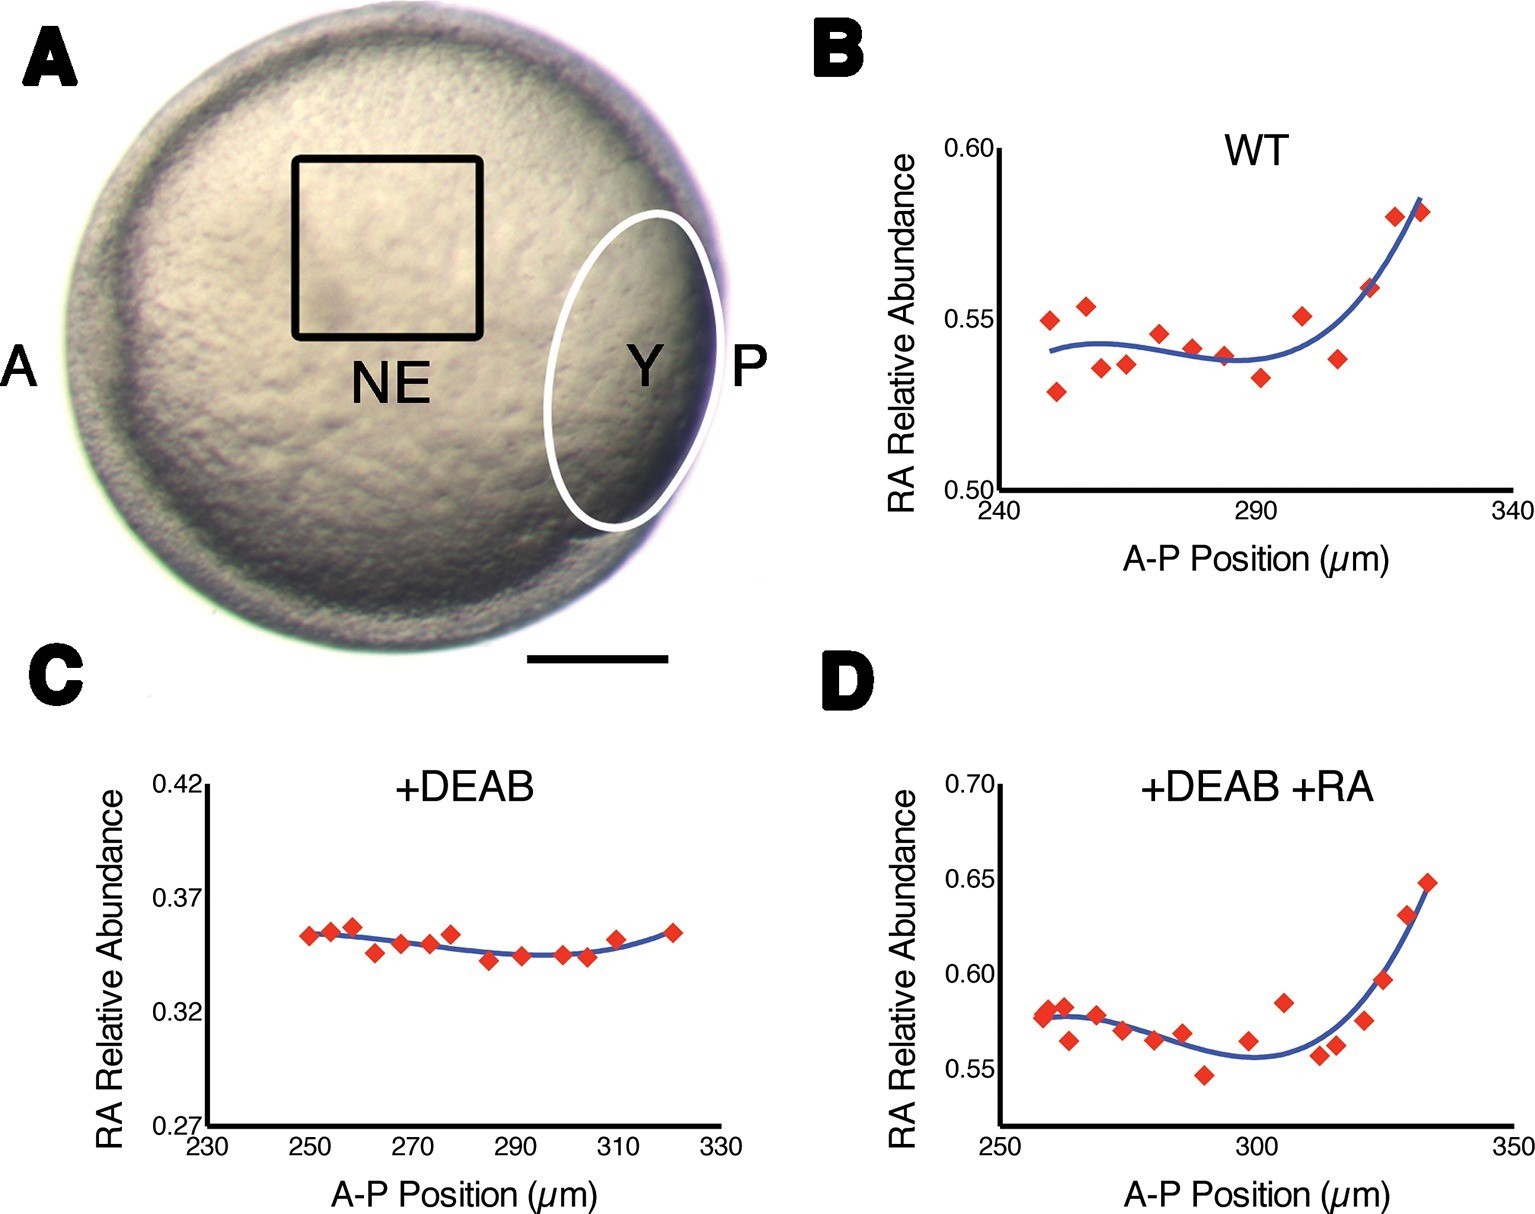
Fig. 1
Measuring RA gradients in zebrafish embryos with Phasor-FLIM.
(A) Example of a zebrafish embryo at mid-gastrula stage (8.5 hr post-fertilization) with the imaging area (black square – encompassing positions 230–330 in B-D) in the neural ectoderm (NE) centered ~200 μm from the advancing blastoderm margin (white line) (A: anterior, P: posterior, Y: yolk). Scale bar = 150 μm. (B-D) Plots of the relative abundance of RA (as the difference 1-dRA) versus position in μm along the A-P axis (anterior to the left) in WT (B), DEAB-treated (C), and DEAB-treated embryos co-treated with 0.7 nM exogenous RA (D). Solid curves in (B-D) represent best fit.