
|
Fig. 1 S1
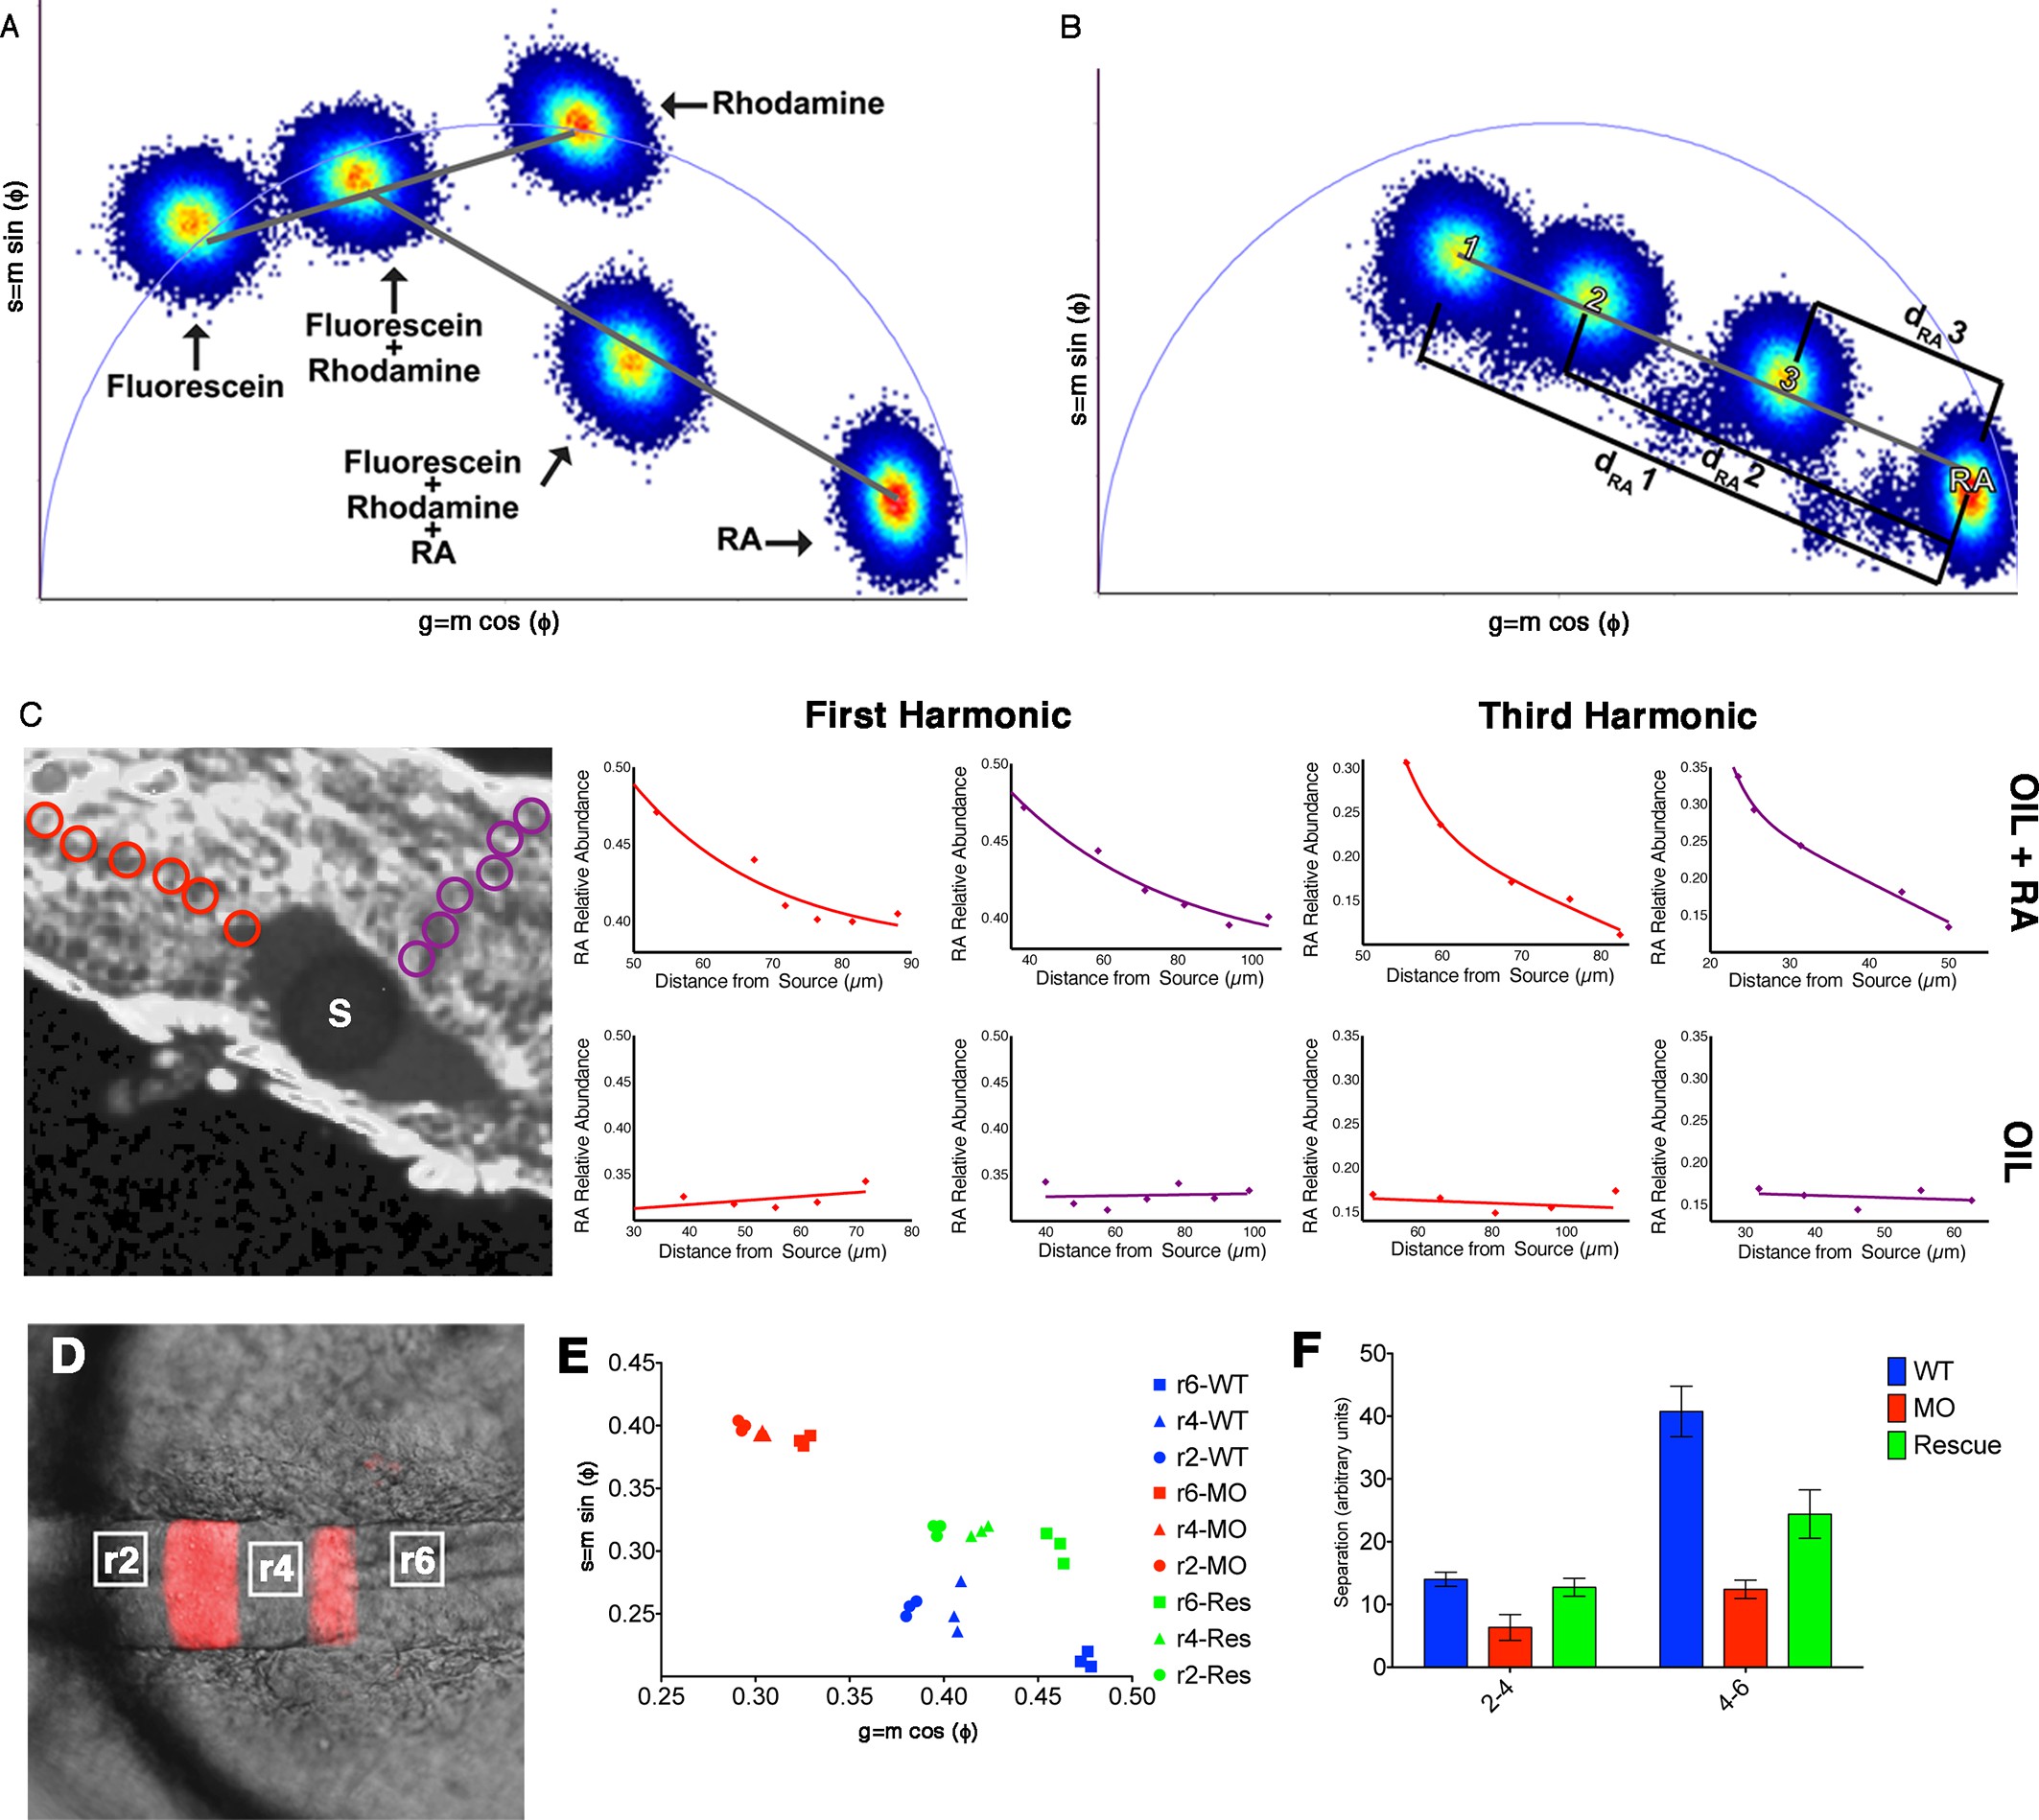
Phasor-FLIM detects relative levels of RA.
(A) Schematic representation of how shifts in measurements displayed on the phasor plot reflect relative levels of each component in a complex mixture. Each plotted position is the weighted linear composition of the positions of all of the autofluorescent constituents (rhodamine, fluorescein and RA) of the mixture. (B) Graphic representation of the measured distance used to calculate the relative abundance of RA (1-dRA). The diameter of the phasor plot equals 1 and thus, the function 1-dRA can never reach zero (even in total absence of RA). (C) Fluorescence intensity image of a zebrafish embryo with an implanted, RA-infused oil droplet to create an ectopic source (S); scale bar = 50 um. Red and purple circles represent the positions measured and graphed for the oil + RA embryo (top row). The plots represent the relative abundance of RA (as the difference 1-dRA) with respect to distance from the source (lines represent best fit curves). Analysis of the RA distribution from an ectopic RA source at the 3rd harmonic, corresponding to measurements at the 1st harmonic, reveals that the observed differences are due to changes in the relative abundance of RA. Embryos injected with oil alone (bottom row) show no detectable differences in the distribution or RA with distance. Plots presented are representative figures from 6–12 embryos from each condition, with three independent datasets. (D) mCherry fluorescence in r3 and r5 combined with DIC in a living Tg(shhb:KalTA4,UAS-E1b:mCherry) transgenic zebrafish hindbrain (anterior to the left) used for FLIM measurements. White boxes represent areas assessed by FLIM in E and F. (E) Phasor plot showing typical FLIM signatures for these three areas in wildtype embryos (blue), embryos injected with Aldh1a2-MO (red) or injected with Aldh1a2-MO and subsequently rescued by transplanting WT paraxial mesoderm (green). The FLIM signatures in rhombomeres of MO-injected embryos lie further away from that of absolute RA, indicating reduced RA concentration. Transplanted WT mesoderm partially rescues the positions of FLIM-signatures for each rhombomere in the phasor plot. (F) Quantification of the distances of r2-r4 and r4-r6 in the phasor space. The separation of RA levels in these rhombomeres is significantly reduced in MO-injected embryos and rescued by transplanted WT mesoderm.