
- Title
-
BMP and RA signaling cooperate to regulate Apolipoprotein C1 expression during embryonic development
- Authors
- Wang, Y., Li, W.H., Li, Z., Liu, W., Zhou, L., Gui, J.F.
- Source
- Full text @ Gene
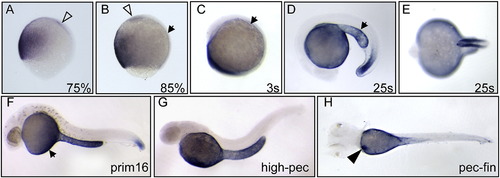
Spatiotemporal expression pattern of apoc1 in zebrafish embryos. Dorsal to the right at early stages (A–C) and head to the left at late stages (D–H). Lateral view unless indicated; H: dorsal view; E: ventral view. prechordal plate is indicated by blank arrowheads. YSL is indicated by arrows. Liver region is indicated by black arrowhead. |
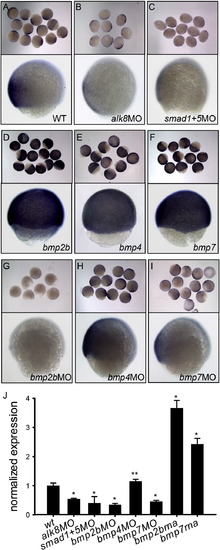
Effect of BMP signaling on apoc1 expression at gastrula stage. (A–I) One-cell stage embryos injected with indicated MOs or mRNAs were raised to gastrula and visualized by WISH using antisense probe of apoc1. smad1 + 5MO: the mixture of smad1MO (0.25 mM) and smad5MO (0.25 mM). Lower panels (dorsal to the right and anterior to the top) show the single embryo in upper panels. (J) apoc1 expression was examined by qPCR. Error bars represent mean + s.d., *P < 0.001, **P < 0.05, one way AVOVA with Holm–Sidak method. |
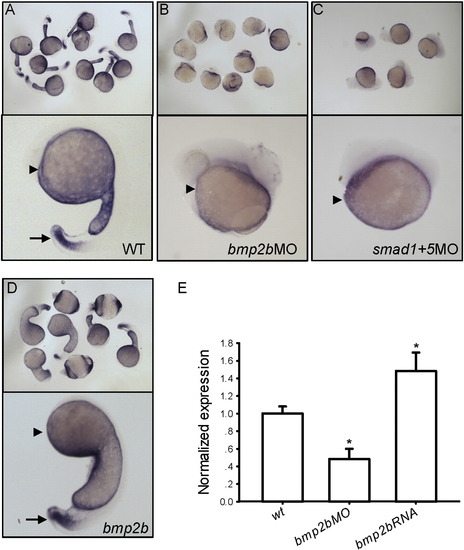
Effect of BMP signaling on apoc1 expression at 26-somite stage in zebrafish. (A–D) One-cell stage embryos injected with indicated MOs or mRNAs were raised to 22 hpf and visualized by WISH using antisense probe of apoc1. smad1 + 5MO: the double knockdown of Smad1 and Smad5. Lower panels (lateral view) show the single embryo in upper panels. Arrowheads indicate YSL and arrows indicate tail. (E) apoc1 expression was examined by qPCR. Error bars represent mean + s.d., *P < 0.001, one way AVOVA with Holm–Sidak method. |
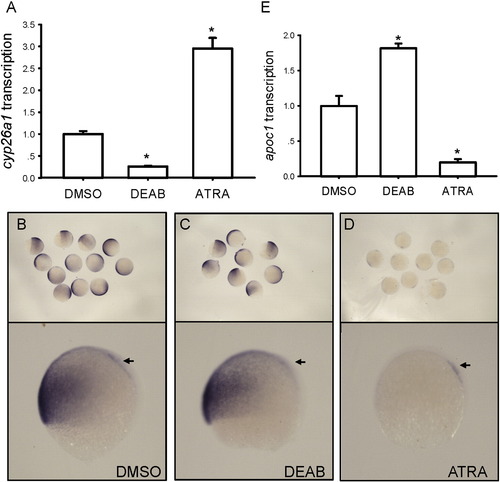
Effect of RA signaling on apoc1 expression at gastrula stage. (A) cyp26a1 expression was examined in ATRA and DEAB-treated embryos by qPCR. (B–D) embryos treated with ATRA and DEAB were visualized by WISH using antisense probe of apoc1. Lower panels (dorsal to the right and anterior to the top) show the single embryo in upper panels. Arrows indicate prechordal plate. (E) apoc1 expression was examined by qPCR. DMSO was used as control. Error bars represent mean + s.d., *P < 0.001, one way AVOVA with Holm–Sidak method. |
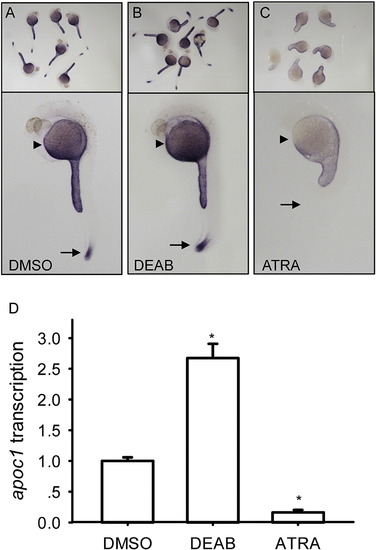
Effect of RA signaling on apoc1 expression at 26-somite stage. (A–C) embryos treated with ATRA and DEAB were visualized by WISH using antisense probe of apoc1. Lower panels (lateral view) show the single embryo in upper panels. Arrowheads indicate YSL and arrows indicate tail. (D) apoc1 expression was examined by qPCR. DMSO was used as control. Error bars represent mean + s.d., *P < 0.001, one way AVOVA with Holm–Sidak method. |
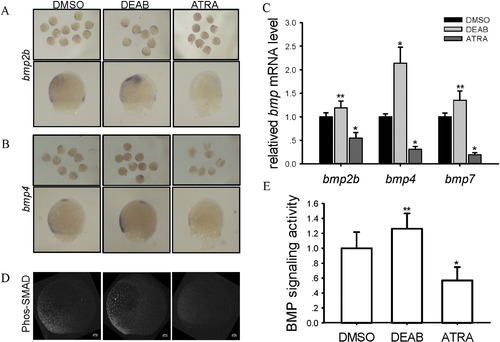
Effect of RA signaling on BMP signaling. (A and B) embryos treated with ATRA and DEAB were visualized by WISH using antisense probes of bmp2b and bmp4. Lower panels (dorsal to the right and animal to the top) show the single embryo in upper panels. (C) bmps expression were examined by qPCR and normalized to DMSO (n = 3). β-actin was used as the internal control gene. (D) The transcript activation of BMP signaling was tested by immunofluorescence using anti-phosphorylated Smad1/5/8 antibody (dorsal to the right and animal to the top). (E) Fluorescence was quantified and normalized to DMSO (n = 9 for each sample). DMSO was used as control. Error bars represent mean + s.d., *P < 0.001, **P < 0.05, one way AVOVA with Holm–Sidak method. |
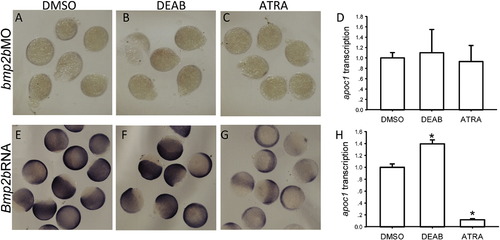
Crosstalk between RA and BMP signaling during gastrulation. (A–C, E–G) Embryos injected with bmp2b morpholino (A–C) and bmp2b mRNA (E–G) treated with DMSO, DEAB and ATRA were visualized by WISH using antisense probes of apoc1. (D, H) apoc1 expression was examined by qPCR in Bmp2b morphants (D) and in bmp2b-overexpressing embryos (H), and normalized DMSO (n = 3). β-actin was used as the internal control gene. Error bars represent mean + s.d., *P < 0.001, one way AVOVA with Holm–Sidak method. |
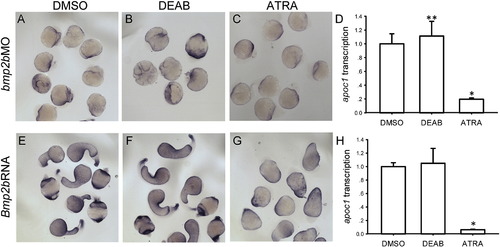
Crosstalk between RA and BMP signaling during somitogenesis. (A–C, E–G) Embryos injected with bmp2b morpholino (A–C) and bmp2b mRNA (E–G) treated with DMSO, ATRA and DEAB were visualized by WISH using antisense probes of apoc1. (D, H) apoc1 expression was examined by qPCR in Bmp2b morphants (D) and in bmp2b-overexpressing embryos (H), and normalized to DMSO (n = 3). β-actin was used as the internal control gene. Error bars represent mean + s.d., *P < 0.001, **P < 0.05, one way AVOVA with Holm–Sidak method. |
Reprinted from Gene, 554, Wang, Y., Li, W.H., Li, Z., Liu, W., Zhou, L., Gui, J.F., BMP and RA signaling cooperate to regulate Apolipoprotein C1 expression during embryonic development, 196-204, Copyright (2015) with permission from Elsevier. Full text @ Gene