
IMAGE
Fig. 1
- ID
- ZDB-IMAGE-150414-1
- Publication
- Wang et al., 2015 - BMP and RA signaling cooperate to regulate Apolipoprotein C1 expression during embryonic development
- All Figures
- Figures for Wang et al., 2015
Image
|
Figure Caption
Fig. 1
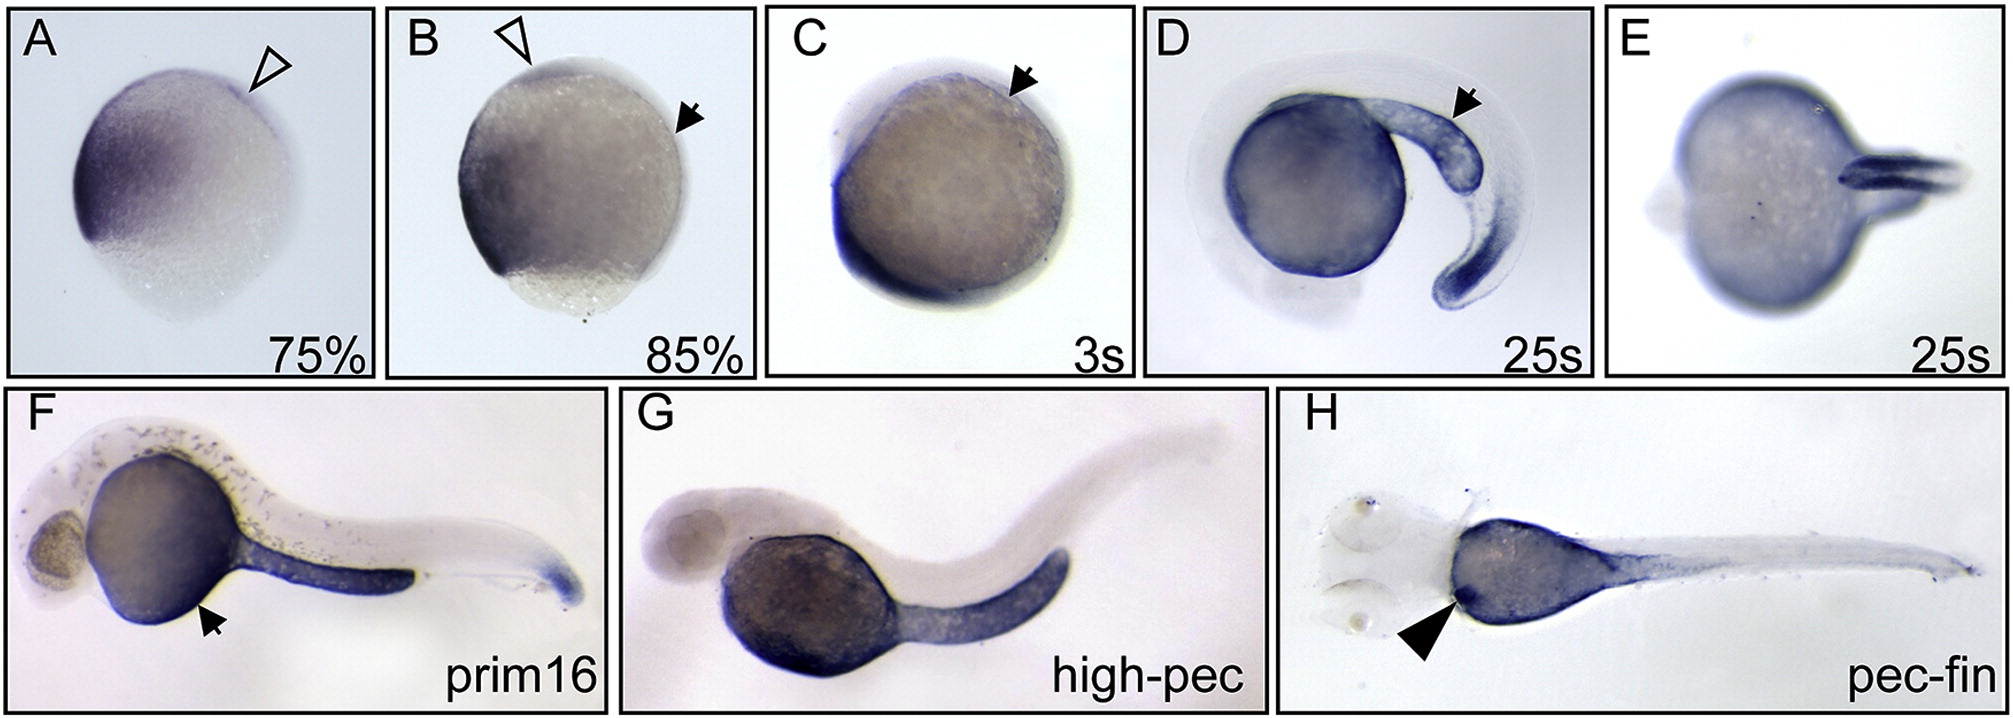
Spatiotemporal expression pattern of apoc1 in zebrafish embryos.
Dorsal to the right at early stages (A–C) and head to the left at late stages (D–H). Lateral view unless indicated; H: dorsal view; E: ventral view. prechordal plate is indicated by blank arrowheads. YSL is indicated by arrows. Liver region is indicated by black arrowhead.
Acknowledgments
This image is the copyrighted work of the attributed author or publisher, and
ZFIN has permission only to display this image to its users.
Additional permissions should be obtained from the applicable author or publisher of the image.
Reprinted from Gene, 554, Wang, Y., Li, W.H., Li, Z., Liu, W., Zhou, L., Gui, J.F., BMP and RA signaling cooperate to regulate Apolipoprotein C1 expression during embryonic development, 196-204, Copyright (2015) with permission from Elsevier. Full text @ Gene