
IMAGE
Fig. 5
- ID
- ZDB-IMAGE-150414-5
- Publication
- Wang et al., 2015 - BMP and RA signaling cooperate to regulate Apolipoprotein C1 expression during embryonic development
- All Figures
- Figures for Wang et al., 2015
Image
|
Figure Caption
Fig. 5
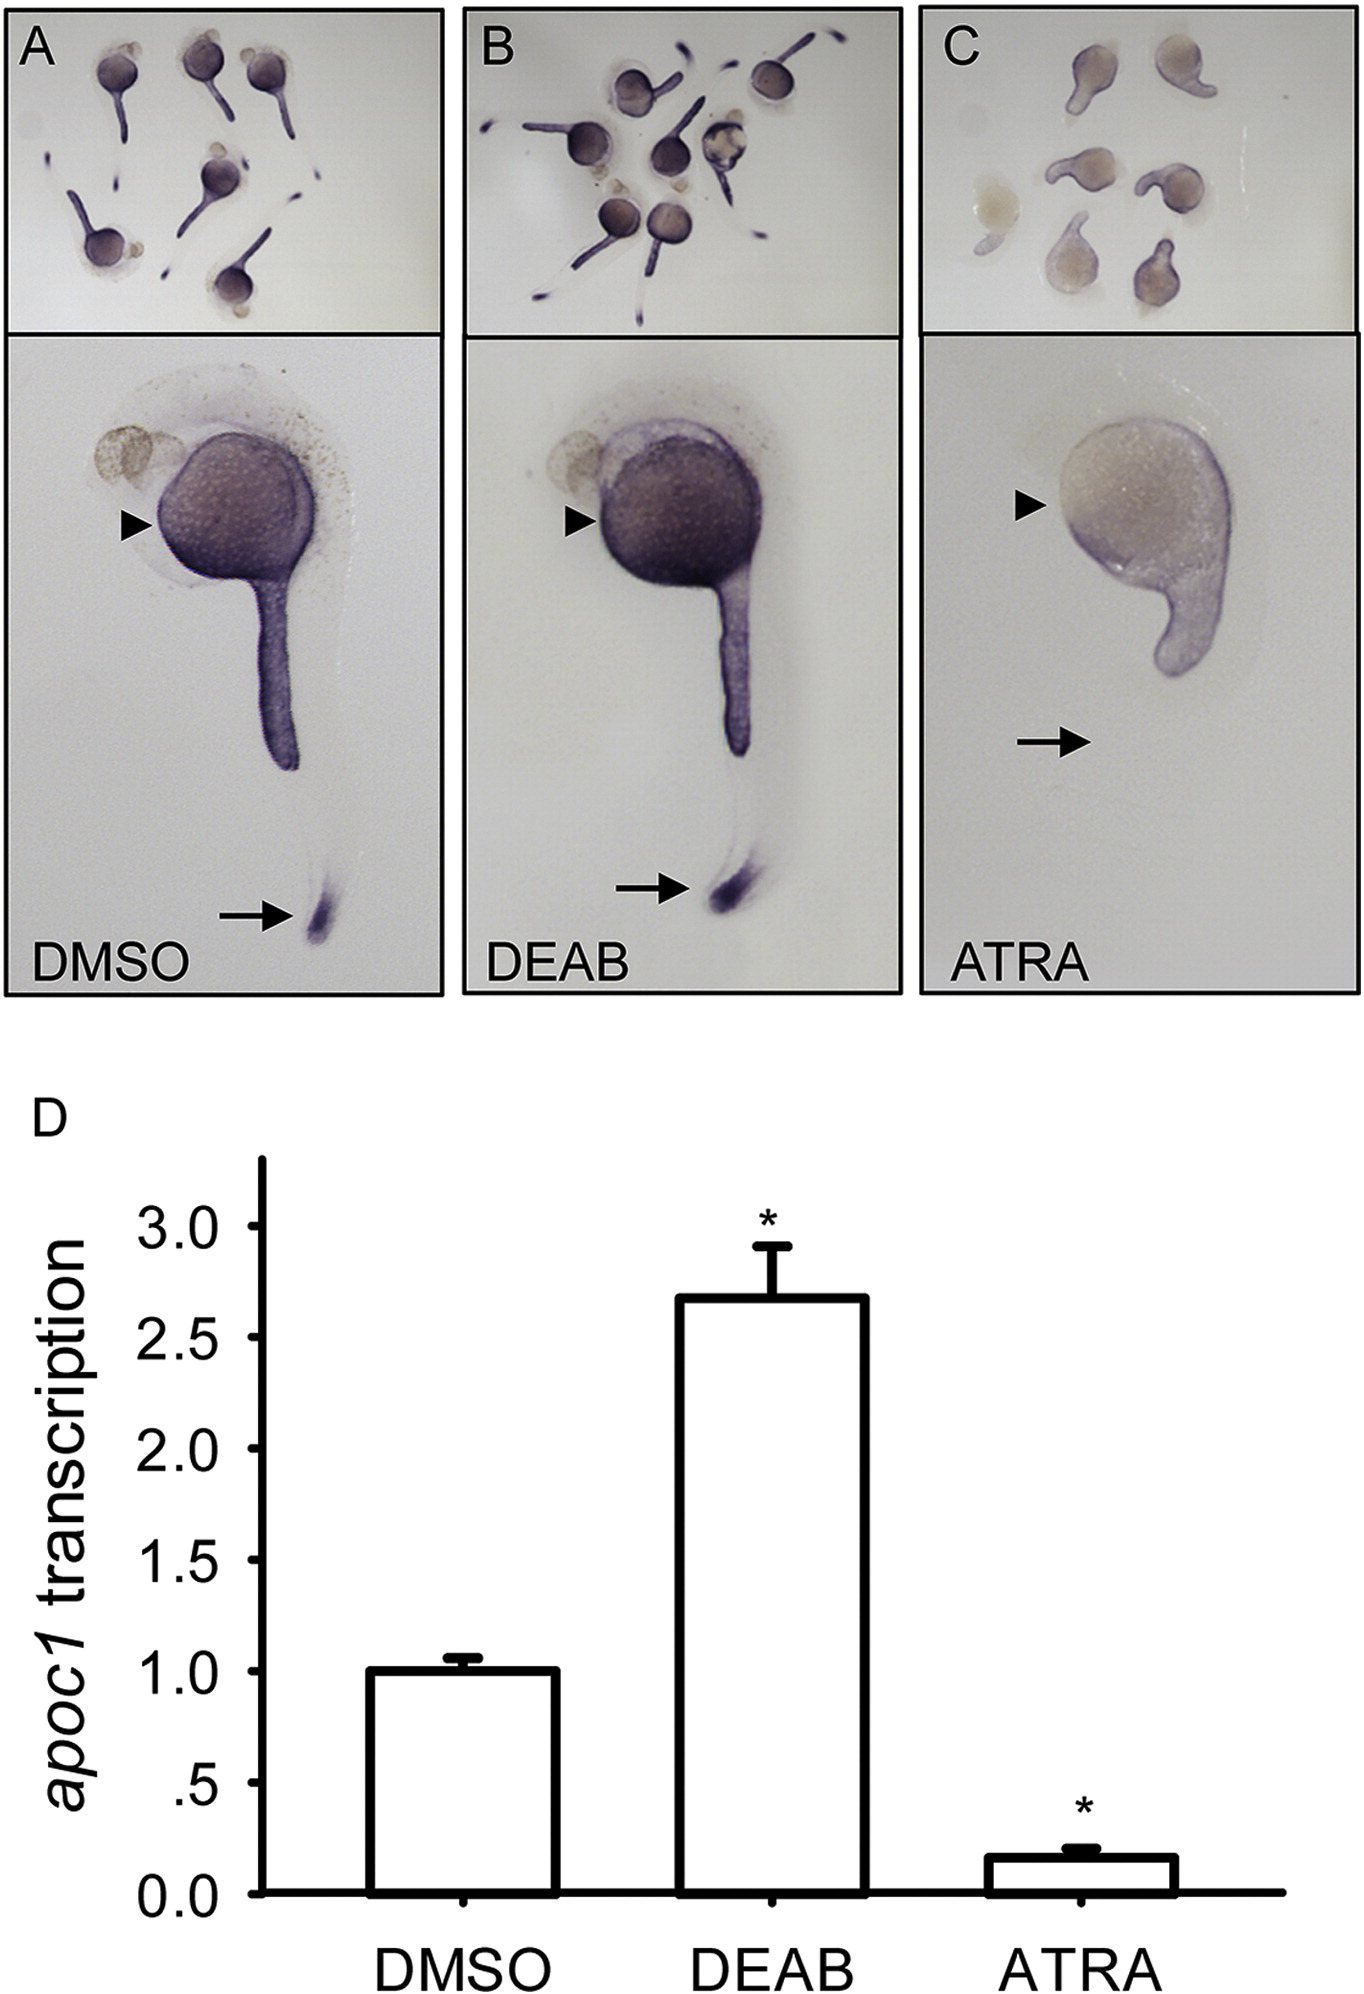
Effect of RA signaling on apoc1 expression at 26-somite stage.
(A–C) embryos treated with ATRA and DEAB were visualized by WISH using antisense probe of apoc1. Lower panels (lateral view) show the single embryo in upper panels. Arrowheads indicate YSL and arrows indicate tail. (D) apoc1 expression was examined by qPCR. DMSO was used as control. Error bars represent mean + s.d., *P < 0.001, one way AVOVA with Holm–Sidak method.
Acknowledgments
This image is the copyrighted work of the attributed author or publisher, and
ZFIN has permission only to display this image to its users.
Additional permissions should be obtained from the applicable author or publisher of the image.
Reprinted from Gene, 554, Wang, Y., Li, W.H., Li, Z., Liu, W., Zhou, L., Gui, J.F., BMP and RA signaling cooperate to regulate Apolipoprotein C1 expression during embryonic development, 196-204, Copyright (2015) with permission from Elsevier. Full text @ Gene