
Fig. 6
- ID
- ZDB-IMAGE-150414-6
- Publication
- Wang et al., 2015 - BMP and RA signaling cooperate to regulate Apolipoprotein C1 expression during embryonic development
- All Figures
- Figures for Wang et al., 2015
|
Fig. 6
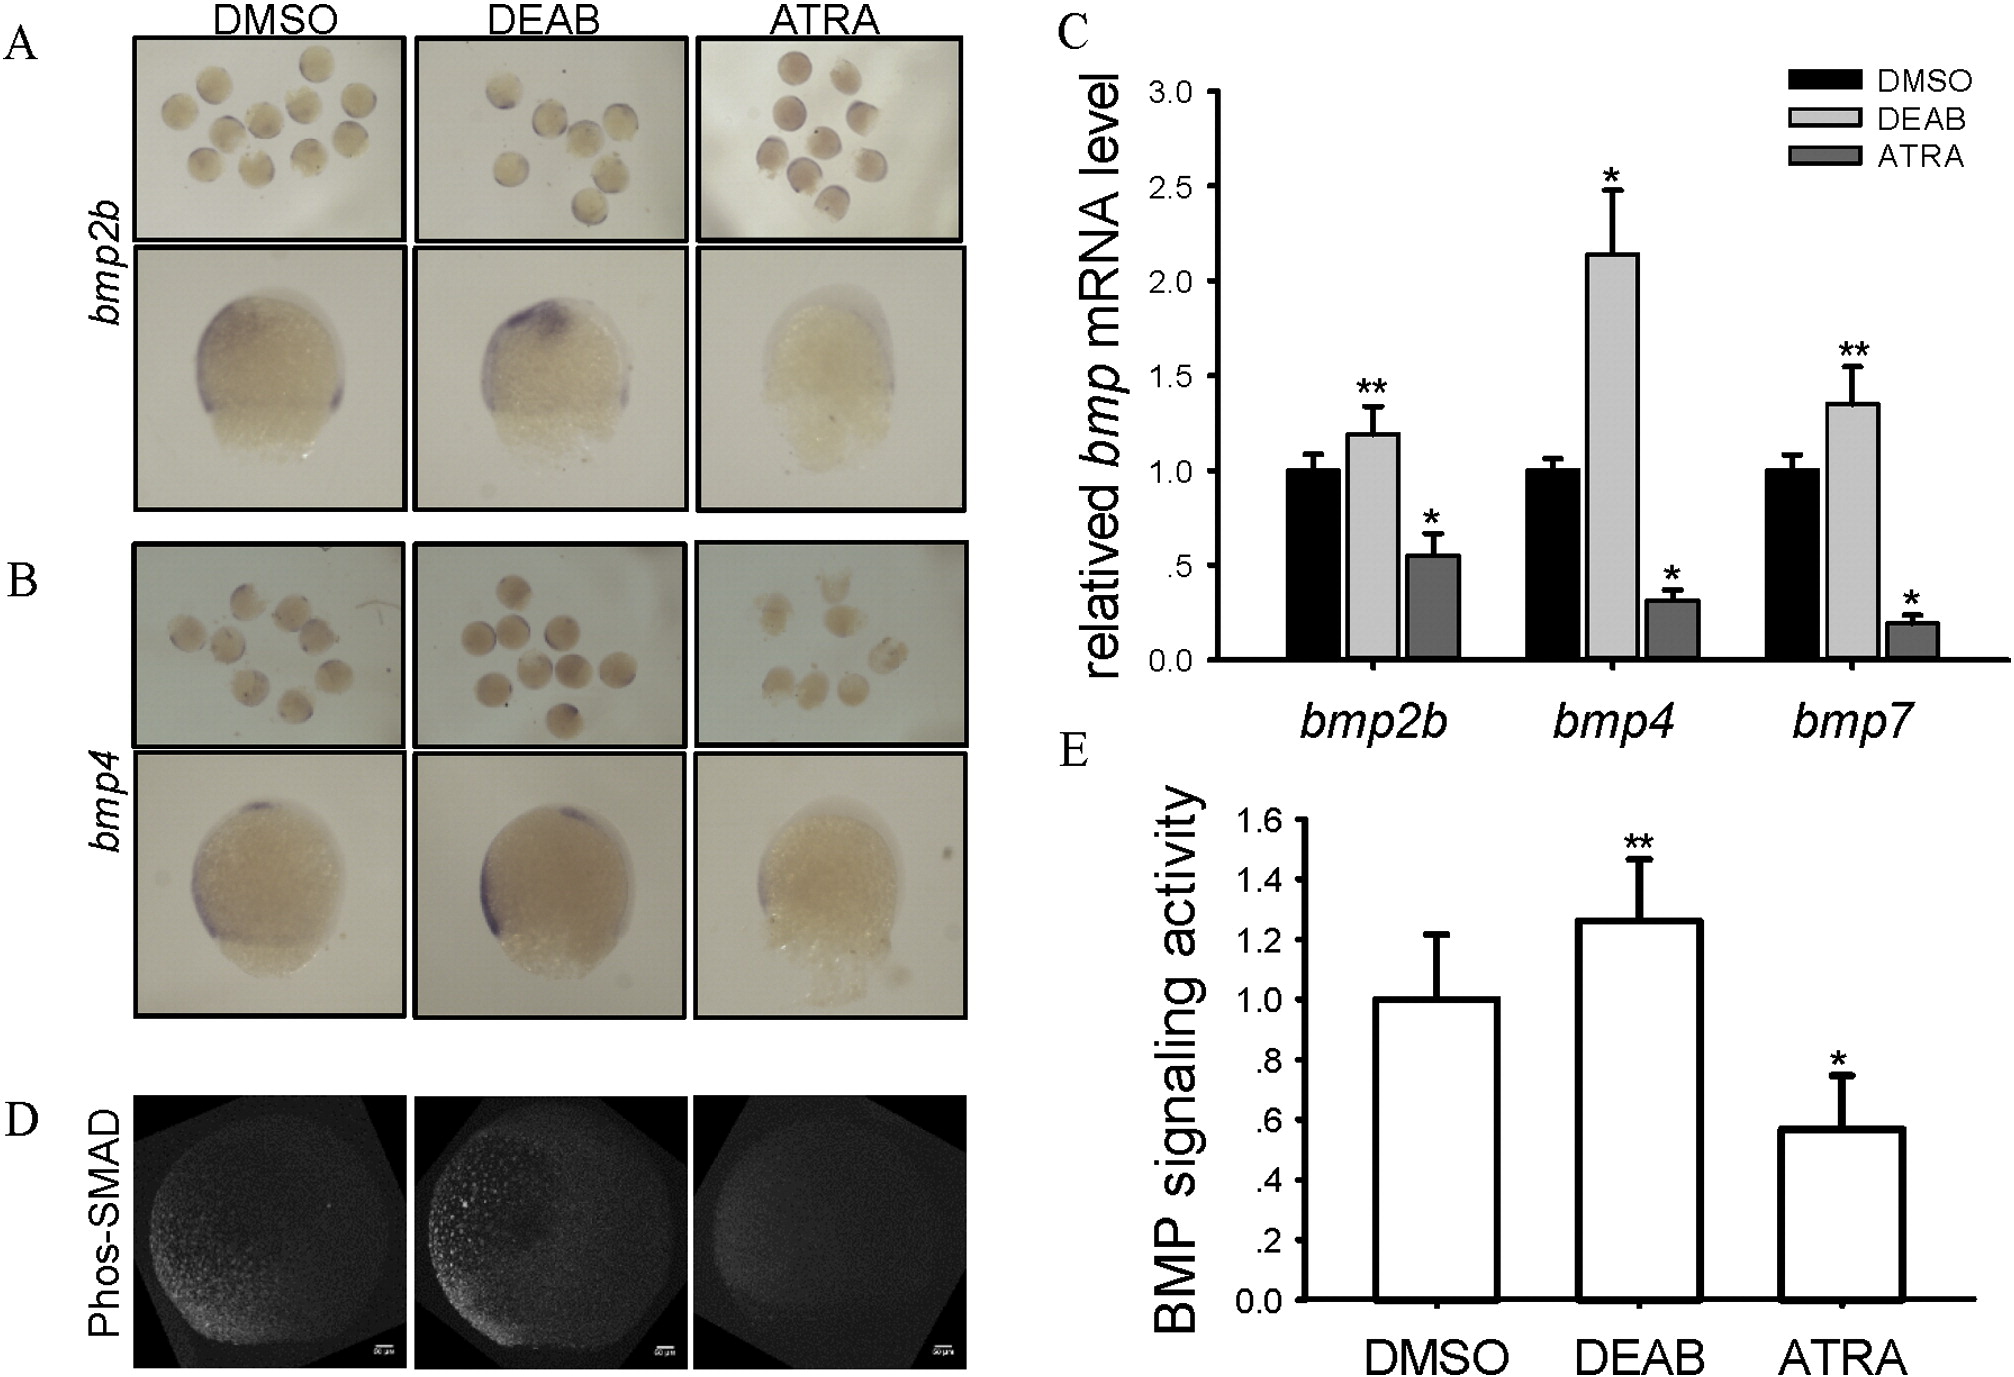
Effect of RA signaling on BMP signaling.
(A and B) embryos treated with ATRA and DEAB were visualized by WISH using antisense probes of bmp2b and bmp4. Lower panels (dorsal to the right and animal to the top) show the single embryo in upper panels. (C) bmps expression were examined by qPCR and normalized to DMSO (n = 3). β-actin was used as the internal control gene. (D) The transcript activation of BMP signaling was tested by immunofluorescence using anti-phosphorylated Smad1/5/8 antibody (dorsal to the right and animal to the top). (E) Fluorescence was quantified and normalized to DMSO (n = 9 for each sample). DMSO was used as control. Error bars represent mean + s.d., *P < 0.001, **P < 0.05, one way AVOVA with Holm–Sidak method.
Reprinted from Gene, 554, Wang, Y., Li, W.H., Li, Z., Liu, W., Zhou, L., Gui, J.F., BMP and RA signaling cooperate to regulate Apolipoprotein C1 expression during embryonic development, 196-204, Copyright (2015) with permission from Elsevier. Full text @ Gene