
- Title
-
The Epicardium in the Embryonic and Adult Zebrafish
- Authors
- Peralta, M., González-Rosa, J.M., Marques, I.J., Mercader, N.
- Source
- Full text @ J Dev Biol
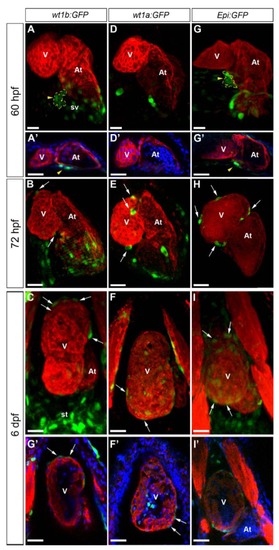
Validation of Wilms’ tumor 1 reporter lines for the study of epicardium development in the zebrafish. Whole mount immunofluorescence for myosin heavy chain (red) in hearts from the Tg(wt1b:GFP), Tg(-6.8kbwt1a:GFP) and Epi:GFP (Et(-26.5Hsa.WT1-1gata2:EGFP)cn1) zebrafish lines at the developmental stages are indicated on the left. Endogenous GFP expression is shown in green. In some panels, nuclear DAPI staining is shown in blue. (A-I) 3D projections. Ventral views are shown; anterior is to the top. (A′-I′) Confocal sections of the whole mount hearts shown in A-I. Arrowheads mark the PE, which is additionally demarcated by a dotted yellow line; arrows mark epicardial cells. (A-C) Tg(wt1b:GFP) labels a few PE cells and epicardial cells and strongly marks the sinus venosus and septum transversum. (D-F) GFP expression in Tg(-6.8kbwt1a:GFP) labels epicardial cells, but the PE is not clearly visible. (G-I) Epi:GFP labels the sinus venosus and septum transversum, as well as PE clusters and epicardial cells. At, atrium; st, septum transversum; sv, sinus venosus; V, ventricle. Scale bars: 30 µm. |
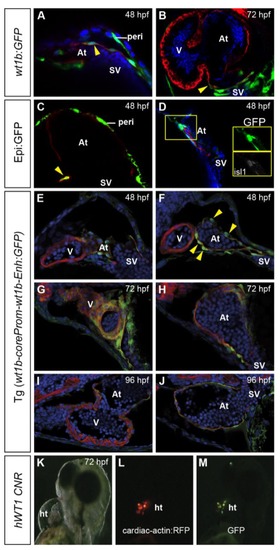
Partial coexpression of GFP and myocardial marker genes in wt1 transgenic lines. Immunofluorescence on sections of different wt1 transgenic lines at stages are indicated in the panels, revealing GFP expression in green and myosin heavy chain (MHC) expression in red, except in panel A, in which red reveals myh6 expression. Cell nuclei are counterstained in blue. Arrowheads mark cells coexpressing GFP and a cardiomyocyte marker. (A and B) wt1b:GFP at 48 and 72 hpf, showing GFP-positive myocardial cells close to the venous pole. (C) Coexpression of Epi:GFP with myh6 in atrial cardiomyocytes close to the venous pole. (D) Coexpression of Epi:GFP with islet 1 (isl1) at the venous pole of the heart. (E–J) Tg(wt1b-coreProm-wt1b-Enh:GFP) embryos expressing GFP in the atrial myocardium. (K–M) Brightfield and fluorescence views of a transient transgenic larva expressing GFP under the control of a conserved human WT1 noncoding genomic region (CNR) and expressing red fluorescent protein (RFP) under the control of a myocardial promoter. Note the cells coexpressing GFP and RFP. At, atrium; ht, heart tube; hpf, hours postfertilization; peri, pericardial mesothelium; SV, sinus venosus; V, ventricle. |
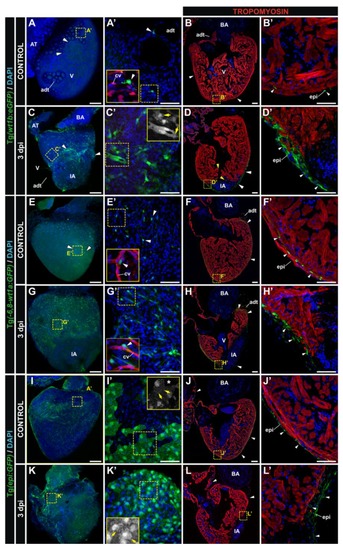
Transgenic reporter lines that mark the adult epicardium during regeneration.Whole mount confocal 3D projections and immunofluorescence on sections of dissected control and cryoinjured hearts at 3 days post-injury (dpi). Hearts are from the Tg(wt1b:GFP) (A-D), Tg(-6.8kbwt1a:GFP) (E-H) and Tg(epi:GFP) (I-L) lines. Anterior is to the top; ventral to the right. Nuclei are counterstained with DAPI (blue). (A′-L′) Zoomed images of the boxed areas in A-L. Insets in (A′), (E′) and (G′) additionally show details of the coronary vasculature (red), reported by the Tg(fli1a:DsRedEx) transgene. Insets in (C′), (I′) and (K′) show the GFP channel from the boxed area. White arrowheads mark GFP-positive cells; yellow arrows mark morphological cell features. adt, adipose tissue; AT, atrium; BA, bulbus arteriosus; cv, coronary vessels; epi, epicardium; IA, injured area; V, ventricle. Bars: 200 µm (full views), 50 µm (magnifications). |