
|
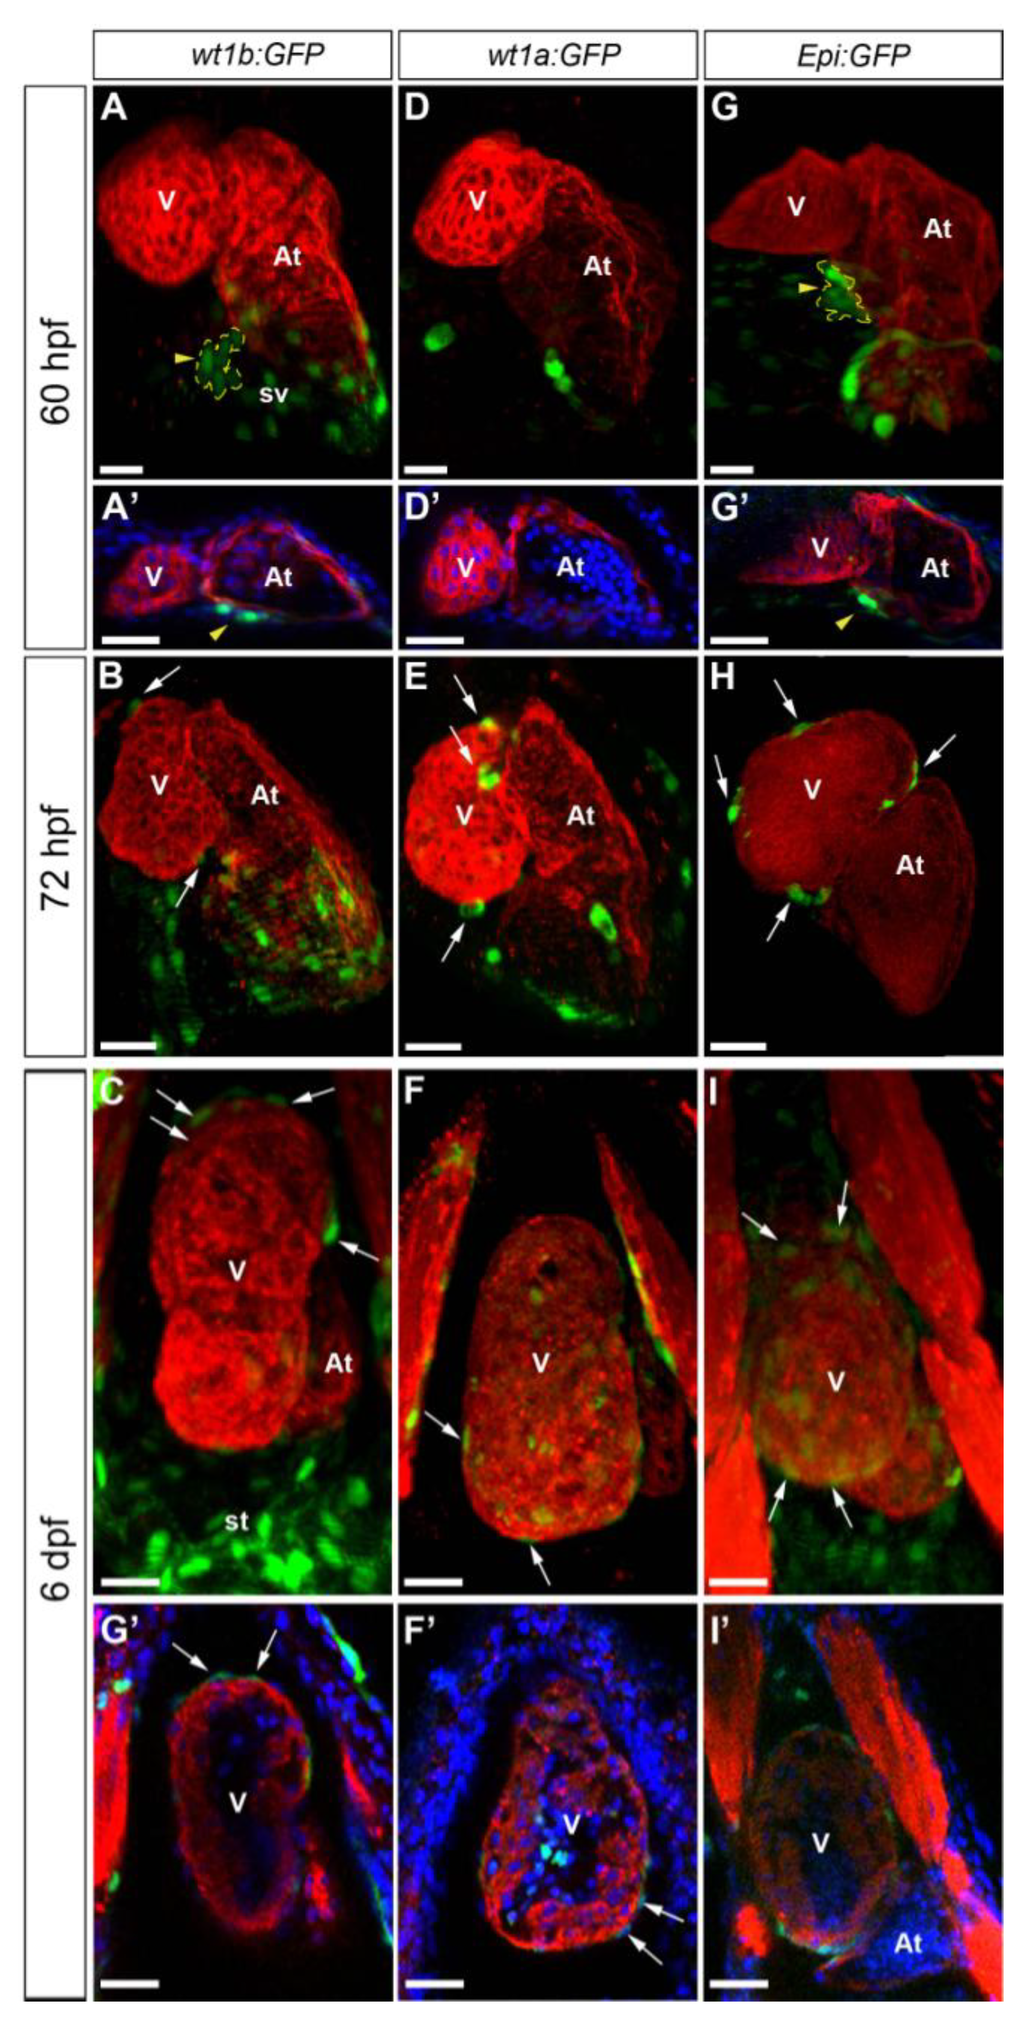
Fig. 2
Validation of Wilms’ tumor 1 reporter lines for the study of epicardium development in the zebrafish. Whole mount immunofluorescence for myosin heavy chain (red) in hearts from the Tg(wt1b:GFP), Tg(-6.8kbwt1a:GFP) and Epi:GFP (Et(-26.5Hsa.WT1-1gata2:EGFP)cn1) zebrafish lines at the developmental stages are indicated on the left. Endogenous GFP expression is shown in green. In some panels, nuclear DAPI staining is shown in blue. (A-I) 3D projections. Ventral views are shown; anterior is to the top. (A′-I′) Confocal sections of the whole mount hearts shown in A-I. Arrowheads mark the PE, which is additionally demarcated by a dotted yellow line; arrows mark epicardial cells. (A-C) Tg(wt1b:GFP) labels a few PE cells and epicardial cells and strongly marks the sinus venosus and septum transversum. (D-F) GFP expression in Tg(-6.8kbwt1a:GFP) labels epicardial cells, but the PE is not clearly visible. (G-I) Epi:GFP labels the sinus venosus and septum transversum, as well as PE clusters and epicardial cells. At, atrium; st, septum transversum; sv, sinus venosus; V, ventricle. Scale bars: 30 µm.