
- Title
-
Juxtaposition of chemical and mutation-induced developmental defects in zebrafish reveal a copper-chelating activity for kalihinol f
- Authors
- Sandoval, I.T., Manos, E.J., Van Wagoner, R.M., Delacruz, R.G., Edes, K., Winge, D.R., Ireland, C.M., and Jones, D.A.
- Source
- Full text @ Chem. Biol.
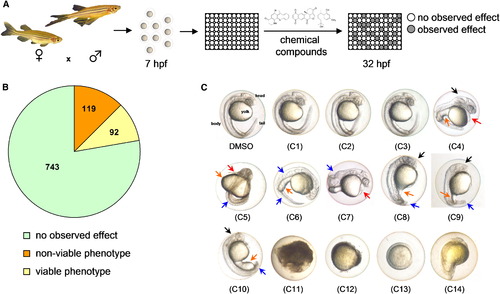
Zebrafish-Based Chemical Screen Leads to Identification of Interesting Phenotypes (A) Schematic of the zebrafish phenotype screen. Wild-type embryos were arrayed in 96-well plates and treated with 10 μM or 25 μg/ml of test compounds at 7 hpf. Phenotypes were scored at 32 hpf. (B) Pie chart showing phenotype distribution from the zebrafish screen. (C) At 32 hpf, zebrafish embryos have a defined head, body, and tail, with a prominent yolk (C, DMSO). Normal-looking embryos were observed for 743 compounds (C1–C3), 119 were toxic to embryos (C11–14), and 92 had viable phenotypes (C4–C10) that include edema (red arrow), underdeveloped head (black arrow), yolk (orange arrow), and tail/body (blue arrow) malformations. |
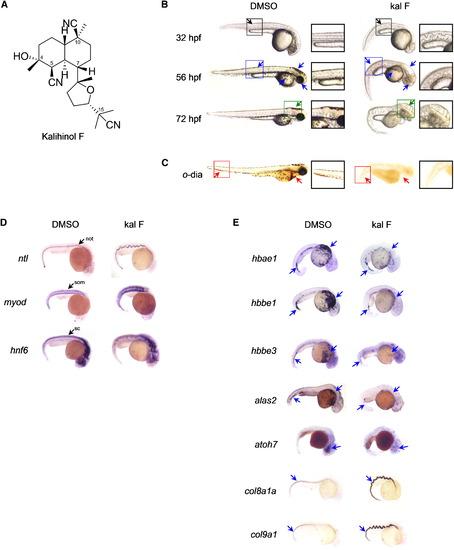
Embryos Treated with Kalihinol F Show a Phenotype Consistent with Copper Deficiency (A) Chemical structure of kalihinol F. (B) Exposure of zebrafish embryos to 2.5 μg/ml of kalihinol F (kal F) resulted in a wavy notochord (black arrow, D, ntl), loss of pigmentation (blue arrow) and enlarged hindbrain vesicle (green arrow) as compared to DMSO-treated control embryos. Boxed figures are enlargements of highlighted portions on whole embryos. (C) o-dianisidine staining at 72 hpf revealed loss of hematopoiesis (red arrows) in treated embryos versus control. (D) In situ hybridization on 32 hpf embryos for ntl, myod, and hnf6. not, notochord; som, somites; and sc, spinal cord. (E) In situ hybridization for hbae1, hbbe1, hbbe3, alas2, atoh7, col8a1a, and col9a1 confirms gene expression analysis by RNA sequencing that is consistent with copper-deficient phenotype of kalihinol F. See also Tables S1 and S2. |
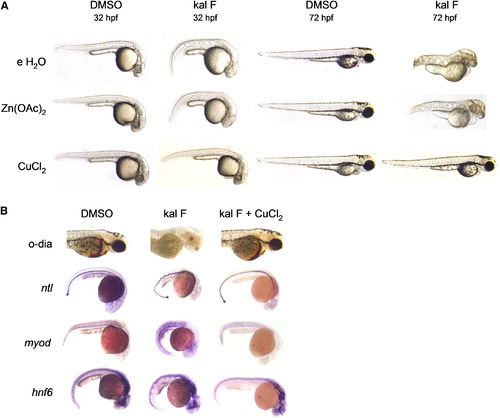
Kalihinol F Phenotype Is Prevented by Addition of Copper (A) Five hr postfertilization embryos were treated with either DMSO or 2.5 μg/ml kal F then rescued at 7 hpf with 10 μM CuCl2, Zn(OAc)2 and embryo water (e H2O). Only copper-treated embryos showed normal pigmentation, notochord, and hindbrain comparable to control embryos (bottom row, second and fourth figures from left).(B) Normal hematopoiesis and rescue of notochord, somites, spinal cord with copper were confirmed by o-dianisidine staining and in situ for ntl, myod, and hnf6. See also Figure S1. |
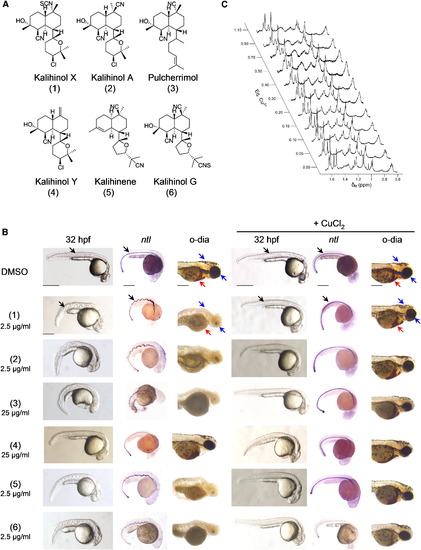
Other Members of the Kalihinol Family also Show Copper Chelating Activity (A) Chemical structure of kalihinol analogs. (B) Seven hr postfertilization embryos were treated with either 25 μg/ml or 2.5 μg/ml of kalihinol analogs and DMSO vehicle control (first, second, and third columns). For phenotype rescue experiments, 5 hpf embryos were treated with kalihinols and given CuCl2 at 7 hpf (fourth, fifth, and sixth columns). Embryos were monitored for wavy notochord (black arrow), loss of pigmentation (blue arrow), and hematopoiesis (red arrow).(C) Effects of addition of Cu2+ to the 1H NMR line widths of the methyl signal region of pulcherrimol. |
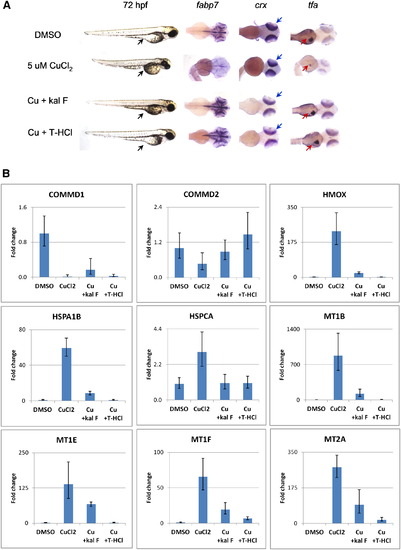
Kalihinol F Reverses Adverse Effects of Copper Toxicity (A) Five hr postfertilization embryos were treated with 5 µM CuCl2 and rescued at 7 hpf with either 5 μg/ml kalihinol F or 10 μM T-HCl. Excessive copper resulted in a smaller embryo with pinched yolk extension (lane 1, black arrow), small head (lane 2) and eyes (lane 3), and impaired liver development (lane 4). In situ hybridization for fabp7, crx (blue arrow), and tfa (red arrow) revealed normal head development, eye size and proper liver formation, respectively, for embryos rescued with kalihinol F or T-HCl. (B) Human HepG2 cells were treated with 80 μM copper and rescued with either 30 μg/ml kalihinol F or 160 μM T-HCl. Quantitative RT-PCR showed gene expression changes induced by copper were reversed by either kalihinol F (Cu + kal F) or T-HCl (Cu + T-HCl). Graph shown above is representative of at least two experiments. Values represent mean ± SD. See also Figure S2 and Table S3. |
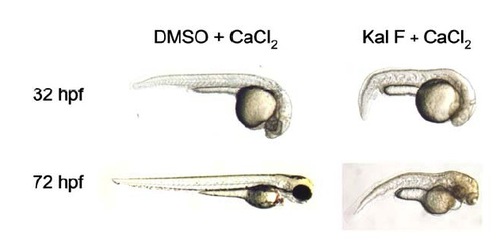
Treatment with 10 μM CaCl2 did not prevent kalihinol F-induced phenotypic abnormalities. |