
|
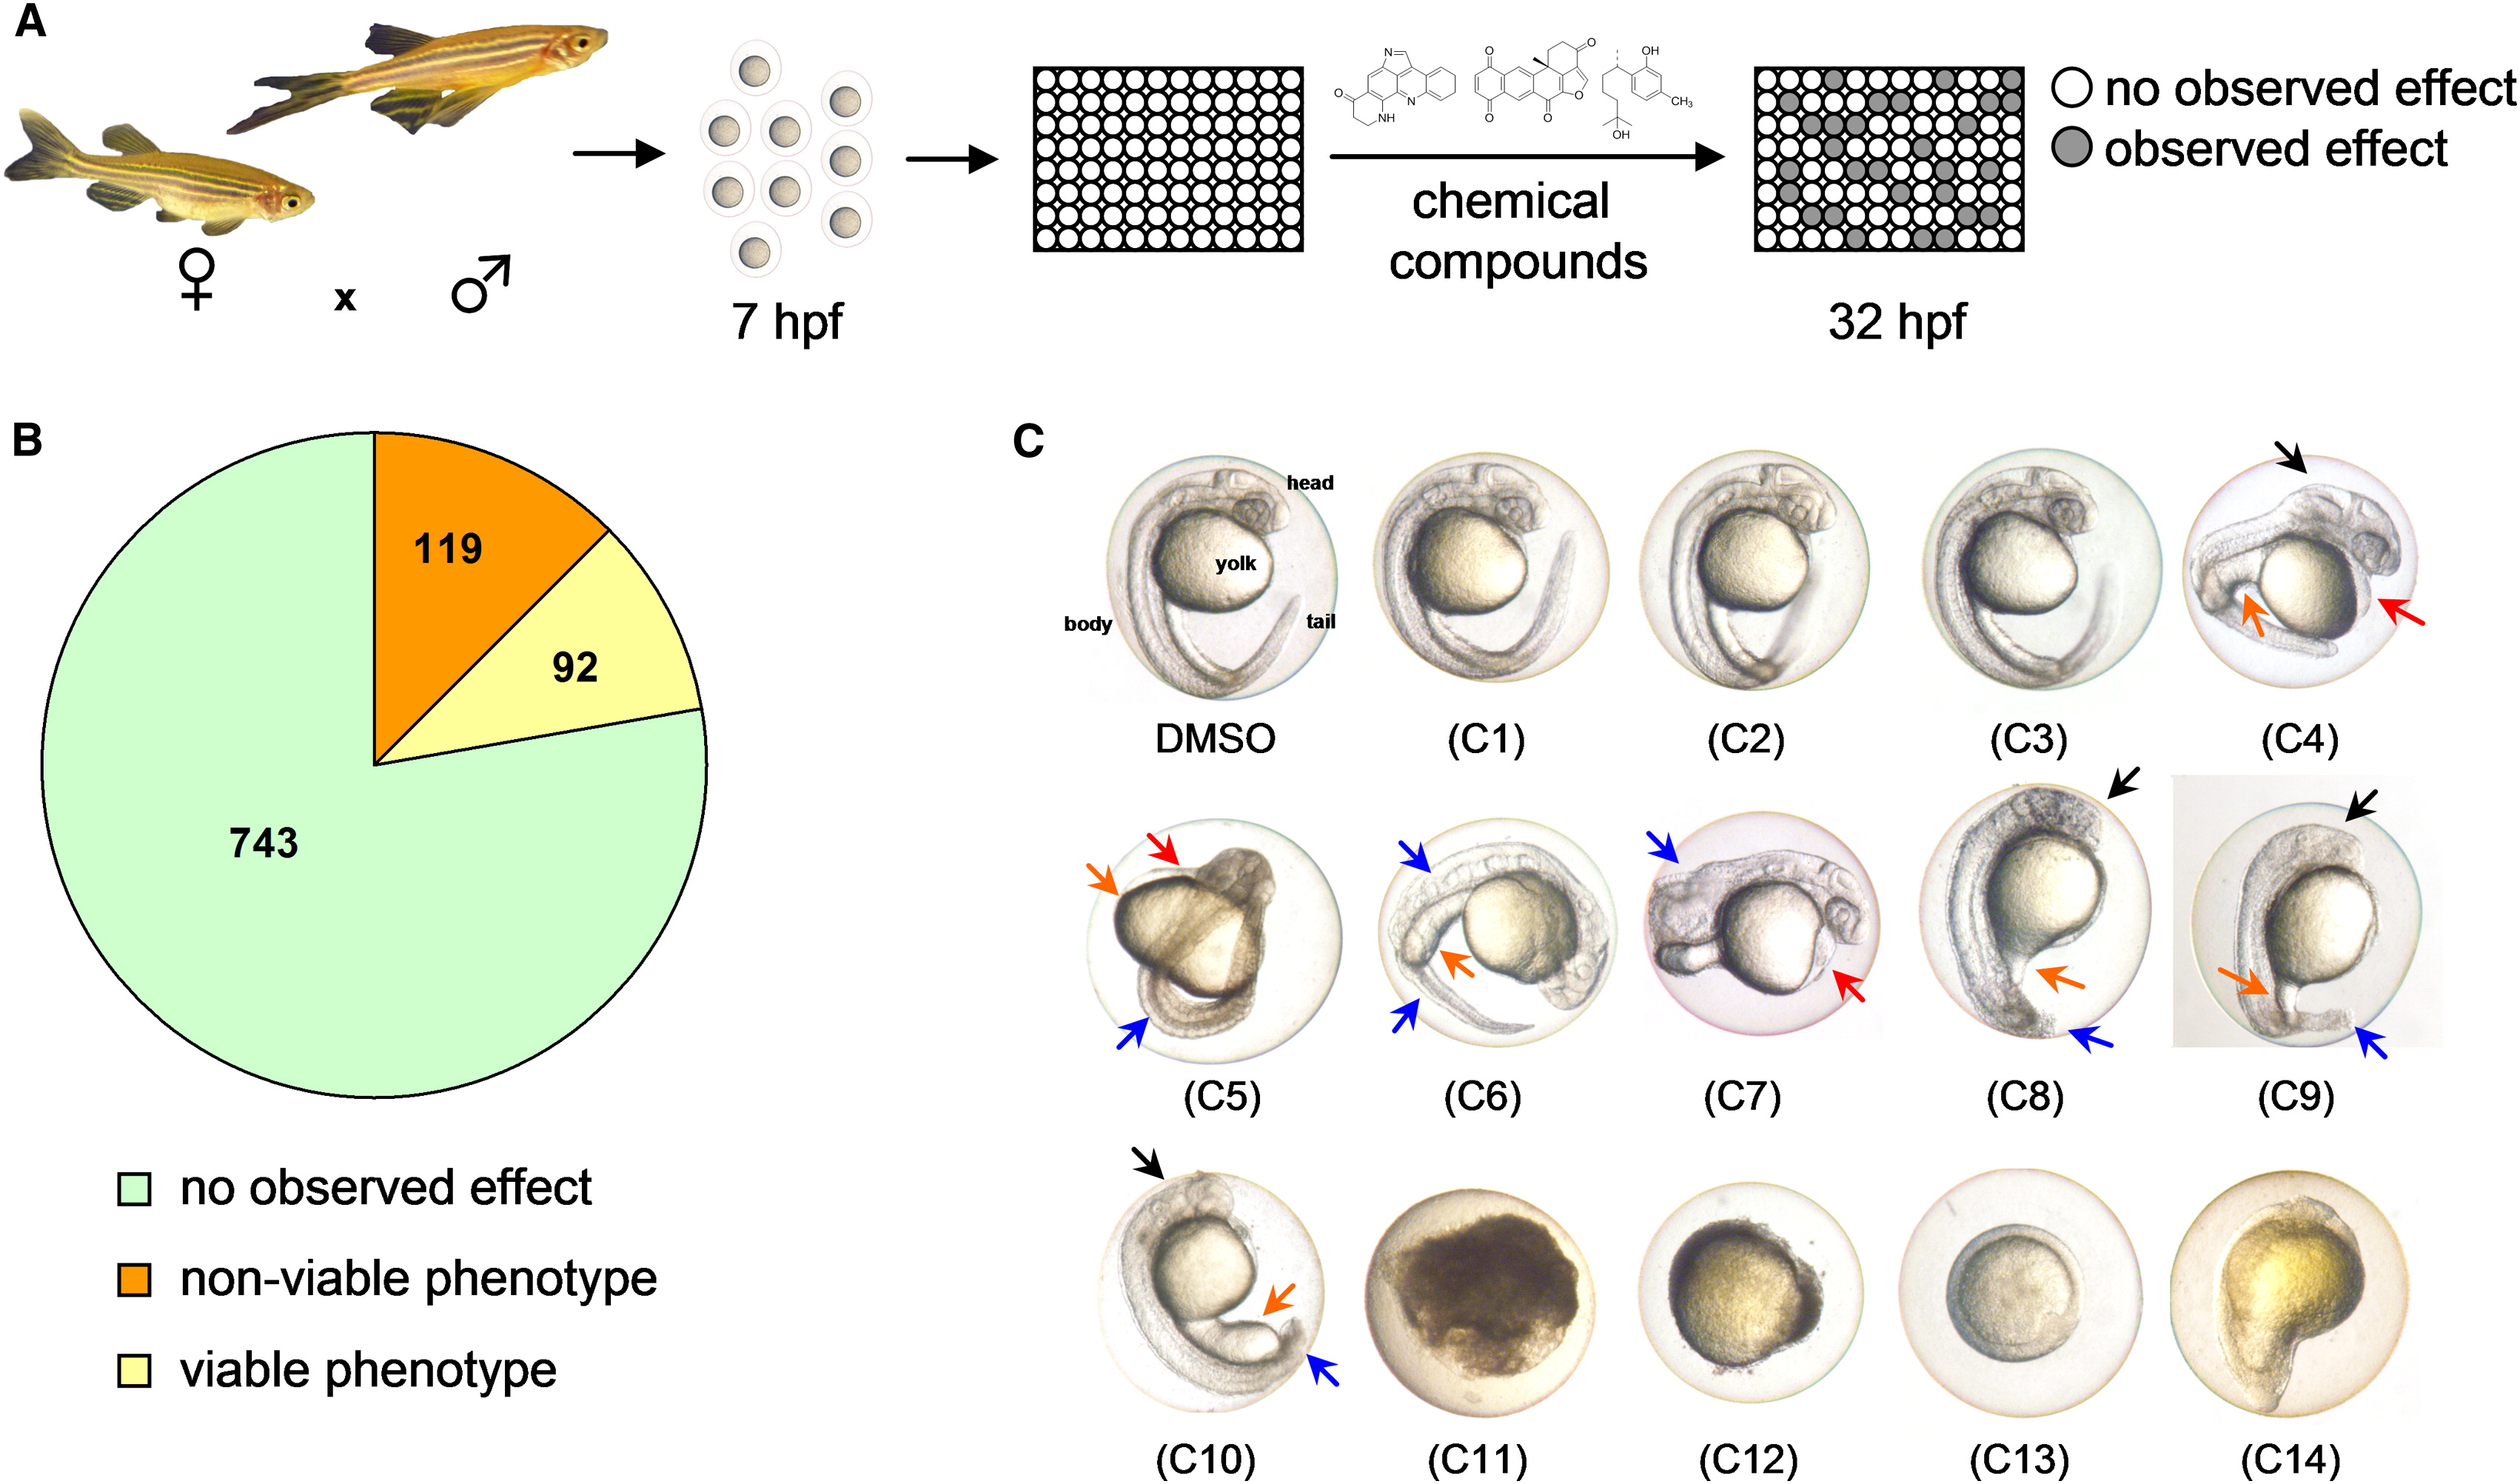
Fig. 1 Zebrafish-Based Chemical Screen Leads to Identification of Interesting Phenotypes (A) Schematic of the zebrafish phenotype screen. Wild-type embryos were arrayed in 96-well plates and treated with 10 μM or 25 μg/ml of test compounds at 7 hpf. Phenotypes were scored at 32 hpf. (B) Pie chart showing phenotype distribution from the zebrafish screen. (C) At 32 hpf, zebrafish embryos have a defined head, body, and tail, with a prominent yolk (C, DMSO). Normal-looking embryos were observed for 743 compounds (C1–C3), 119 were toxic to embryos (C11–14), and 92 had viable phenotypes (C4–C10) that include edema (red arrow), underdeveloped head (black arrow), yolk (orange arrow), and tail/body (blue arrow) malformations.