
- Title
-
Maintenance of Melanophore Morphology and Survival Is Cathepsin and vps11 Dependent in Zebrafish
- Authors
- Clancey, L.F., Beirl, A.J., Linbo, T.H., and Cooper, C.D.
- Source
- Full text @ PLoS One
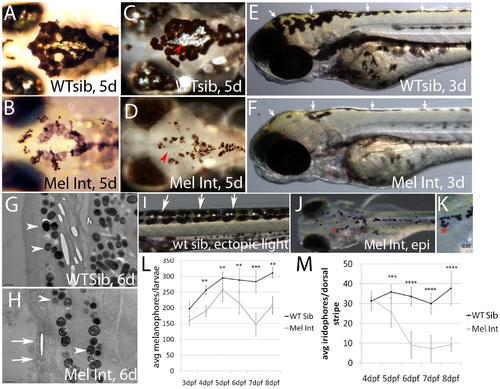
Melanophore integrity mutants show melanophore and iridophore defects. A, B) Dorsal, head images of live wildtype and mutant siblings, 5dpf. Wildtype melanophores maintain dark pigmentation and are now interacting with silver iridescent iridophores (present on eyes and in the center of caudal melanophore patch). Mutant melanophores are underpigmented and beginning to fragment. C, D) Dorsal image of caudal iridophore patch indicated by red arrow heads. Caudal patch and eye iridophores are the first to be affected in integrity mutants. E, F) Lateral image of 3dpf wildtype and integrity mutant larvae. We observe yellow coloration, indicative of xanthophores, in both wildtype and integrity mutant larvae (white arrows). G, H) Transmission electron microscopic images of 6dpf wildtype and integrity mutant larvae. Vertical sections were taken of dorsal stripe tissue and imaged at 3800X. integrity mutant melanosomes (compare arrowheads) are fewer in number and contain several presumed vacuoles as compared to wildtype. Epidermal plasma membranes are also fragmented (see white arrows) and internal organelle organization is disrupted. I-K) Representative images of fish used for quantification of iridophores (I) and melanophores (J, K). Trunk iridophores (in wildtype and mutant fish) are readily visible following epi-illumination using a fiber optic light source (see white arrows in I). Epinephrine promotes internalization of melanosomes, making individual melanophores easier to see and quantify (see red asterisks, which indicate the same region and is magnified in K). Distinct and continuous boundaries were used to designate a melanophore (e.g. the asterisk in K indicates four cells arranged in a U shape. L) Quantification of melanophores (dorsal and lateral stripes were included). Melanophores are significantly reduced as tested by two way ANOVA analysis with a Bonferonni multiple comparisons examining all genotypes and timepoints (p<0.001** or 0.0001***). M) Quantification of dorsal stripe iridophores in wildtype sibling and mutant larvae. Dorsal stripe iridophores are significantly reduced at all timepoints in mutant fish as tested by two way ANOVA analysis with a Bonferonni multiple comparisons examining all genotypes and timepoints (p<0.0001*** or 0.00001****). NOTE: 810 larvae per timepoint were counted; error bars are standard deviation. PHENOTYPE:
|
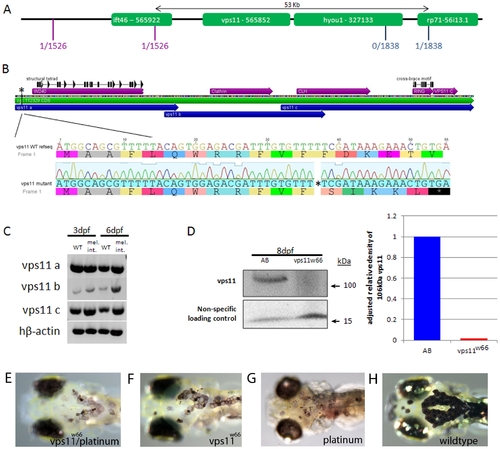
The melanophore integrity gene maps to a 53 kilobase region on chromosome 10. A) Flanking CA repeat markers and their respective number of recombinants per meioses (shown in red and blue) narrowed the region down to 53 kilobases, containing the ift46, vps11 and hyou1 genes. Being the most likely candidate (see text for details), vps11 cDNA was generated and sequenced. B) Sequenced vps11 cDNA indicated a single base pair deletion at base pair 37 which causes a frameshift and early stop at base pairs 5355. Other differences in sequenced vps11 cDNA include a single base pair substitution at base pairs 615 and 2183. C) RT-PCR on wildtype and integrity mutant mRNA indicates that vps11 transcripts are present in integrity mutants. vps11 cDNA was amplified in regions “a”, “b” and “c” as indicated in 2B (blue arrows). D) Immunoblot and densitometry analysis of Vps11 protein expression in wildtype (AB) and vps11w66 mutant larvae. Vps11 protein is not expressed or is expressed at sub detection levels. E-H) Dorsal head images of live, 6dpf zebrafish larvae born from heterozygous vps11 and platinum parents (E), heterozygous vps11 parents (F and H) and heterozygous platinum parents (G). We observed the integrity phenotype in ~25% of the clutch resulting from heterozygous vps11 and platinum matings. EXPRESSION / LABELING:
|
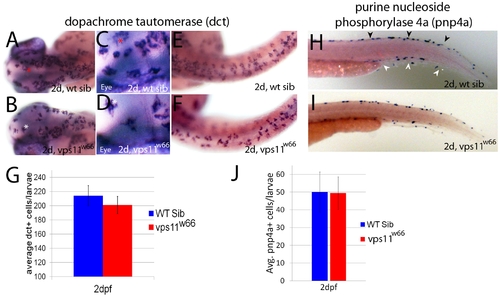
Chromatophore specific gene expression occurs at expected times and in wildtype levels in vps11w66 mutants. A, B) Dorsal head images of 2dpf wildtype and vps11w66 mutant larvae processed for melanophore specific dopachrome tautomerase (dct) expression. dct is detected in the correct place and time in vps11w66 mutants. C, D) Close up examination of dorsal head regions shown in A and B. Asterisks indicate reference cells for orientation. Melanin synthesis was inhibited in all in situ hybridization experiments using 1X 1-phenyl-2-thiourea. E, F) Dorsal images of wildtype and vps11w66 mutant trunk regions. In the trunk, dct is detected in expected levels but we observe uncharacteristic gaps between cells as compared to wildtype siblings. G) Quantification of dct+ cells (dorsal, lateral and ventral stripes) suggests an insignificant reduction in cell number at 2dpf, consistent with pigmented melanophore counts in 1J (p = 0.14 via two way ANOVA with Bonferonni multiple comparisons analysis). Error bars are standard deviation. H, I) Lateral tail images of 2dpf wildtype sibling or vps11w66 mutant larvae processed for iridophore specific purine nucleoside phosphorylase 4a (pnp4a) expression. Dorsal and ventral stripes are indicated in H by black and white arrowheads, respectively. J) Quantification of pnp4a+ cells in 2dpf wildtype and vps11w66 larvae suggest similar numbers of iridophore precursors at this stage (p = 0.85 via two way ANOVA with Bonferonni multiple comparisons). |
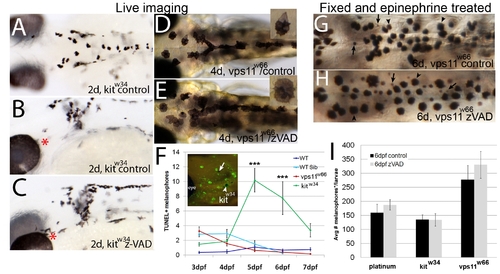
Melanophore loss in vps11w66 mutants is due to a caspase-independent mechanism. AC) Dorsal or lateral head images of 2dpf kitw34 control (A, B) or zVAD-fmk (C) treated larvae, beginning at 1dpf. Red asterisks indicate regions of changes in melanophore morphology and number suggesting rescue following zVAD-fmk treatment. Quantification and student t test indicate a significant increase in melanophore number (kitw34control, 109±9; kitw34zVAD, 147±9 melanophores; p<<0.05 by student t test). DE) Dorsal head and anterior trunk images (6X) of 4dpf (4d) control or zVAD-fmk treated vps11w66 larvae. Inset: 11X magnification of a single melanophore from the same larvae, showing melanosome hyperaggregation and partial hypopigmentation. F) Quantification of TUNEL positive melanophores in wildtype (AB, dark blue), vps11w66 wildtype sibling (cyan), vps11w66 mutant (red) and kitw34 mutant (green) zebrafish. We observe few to no TUNEL positive melanophores in vps11w66 mutants at all timepoints, but a significant number of TUNEL positive melanophores in kitw34 as expected. Two way ANOVA suggests a significant interaction between timepoint and genotype (p<0.0001). Multiple comparison analysis indicates significant differences in TUNEL+ cells between kitw34 and all other genotypes at 5 and 6dpf (p<0.0001***). Inset: Lateral head image of TUNEL positive cells in kitw34 mutant zebrafish (arrowhead, example of a TUNEL positive melanophore included in quantification; arrow, example of a TUNEL negative melanophore, not included in our quantification). Error bars are standard deviation. GH) Dorsal trunk images of fixed 6dpf vps11w66 larvae following control (G) or zVAD-fmk (H) treatment (26dpf; vps11w66 phenotype first observed at 2dpf) and epinephrine treatment to promote melanosome aggregation to ease quantification. Similar to Figure 1, both melanophores (indicated by arrowheads) and presumed melanophore fragments (indicated by arrows) were counted. I) Quantification of dorsal, lateral and ventral stripe melanophores (*and fragments with continous boundaries) in platinum, kitw34 or vps11w66 control or zVAD-fmk treated larvae. Two way ANOVA analysis indicates no significant interaction for genotype and zVAD treatment (Note: zVAD-fmk treatment beginning at 1dpf is required for kitw34 melanophore rescue). |

Treatment with bafilomycin A1 restores melanophore morphology and survival in vps11w66 mutants. A) Dorsal head image (63X) of fixed, 8dpf wildtype larvae. Cells appear completely rounded, as expected following epinephrine induced melanosome aggregation. No vacuoles are observed. B) Dorsal head image of wildtype larvae treated with 25 nM bafilomycin A1 (Baf A1). Cell shape is less rounded, indicating reduced or incomplete melanosome aggregation (arrowhead). Large vacuoles are apparent (arrow). C, D) Dorsal anterior trunk images (63X) of vps11w66 mutant melanophores treated with control (1% DMSO) or 25 nM Baf A1 in embryo media. Cell fragmentation and irregular cell morphology is partially rescued with Baf A1 treatment. E, F) Quantification of melanophores (dorsal and lateral stripes; E) or iridophores (F) in 8dpf wildtype and vps11w66 mutant larvae treated with control (1% DMSO) or 25 nM Baf A1 embryo media. Only melanophores show significant increase in number following Baf A1 treatment. Two way ANOVA indicates a significant interaction between Baf A1 treatment and genotype. One way ANOVA and Bonferonni multiple comparisons analysis examining melanophore numbers within AB and vps11w66 groups, indicates a significant increase in Baf A1 treated vps11w66 larvae as compared to untreated controls (p<0.01*). Error bars are standard deviation. PHENOTYPE:
|
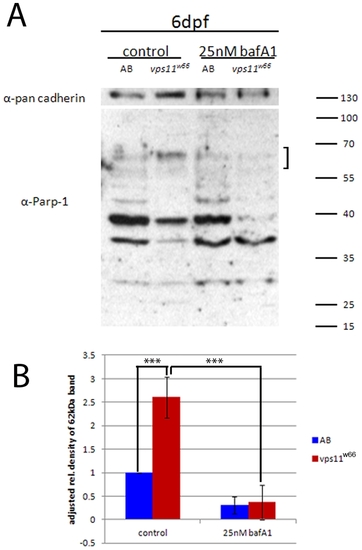
Increased levels of cathepsin protease activity are reduced by bafilomycin A1 treatments. A) Wildtype (AB) and vps11w66 zebrafish lysates were analyzed by PARP-1 immunoblot and densitometry analysis. vps11w66 lysates show higher levels of cathepsin cleavage products at 62 kDa in size as compared to wildtype fish. Treatment of larvae with Baf A1 reduces accumulation of the 62 kDa cleavage product. B) Graphical representation of density analysis of 62 kDa band from three immunoblots using Image J. Samples were analyzed via one way ANOVA with Bonferonni multiple comparison analysis (p<0.0001***). Error bars are standard deviation. PHENOTYPE:
|
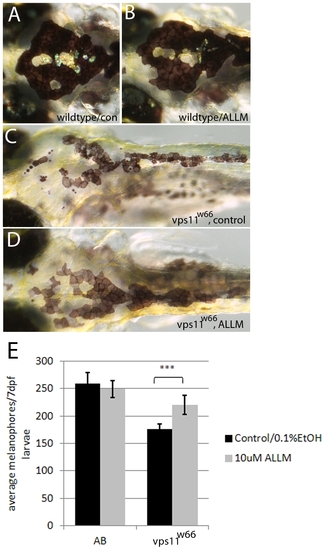
Calpain and Cathepsin inhibitor, ALLM, restores normal melanophore morphology and number. AD) Dorsal images of (7dpf) wildtype or vps11w66 larvae treated with 0.1% EtOH (A, C) or 10 μM ALLM (B, D) from 37dpf. Wildtype melanophore morphology remains unchanged, while vps11w66 melanophores appear more uniform and less fragmented following ALLM treatment. E) Quantification of melanophores (dorsal and lateral stripes) in wildtype (AB) and vps11w66 control or ALLM treated larvae. Note: two way ANOVA indicates a significant interaction between genotype and ALLM treatment (p<0.0001). Additionally, Bonferonni multiple comparison analysis examining effects of treatment within genotype groups suggests a significant increase in vps11w66 melanophores following ALLM treatment (p<0.0001***). Error bars are standard deviation. |
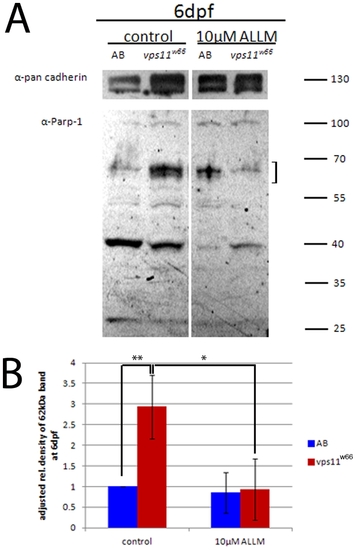
ALLM treatment reduces accumulation of 62 kDa PARP-1 fragment. A) Immunoblot analysis of PARP-1 cleavage fragments in wildtype (AB) and vps11w66 larvae lysates. Treatment of larvae with 10 μM ALLM reduces the 62 kDa fragment (indicative of cathepsin activity; indicated by a bracket) below untreated levels. We also detect a 40 kDa cleavage product, which potentially represents calpain activity (see results text for additional details). B) Graphical representation of density analysis of 62 kDa band from three immunoblots using Image J. Samples were analyzed via one way ANOVA with Bonferonni multiple comparison analysis (p<0.05*, p<0.001**). Error bars are standard deviation. |
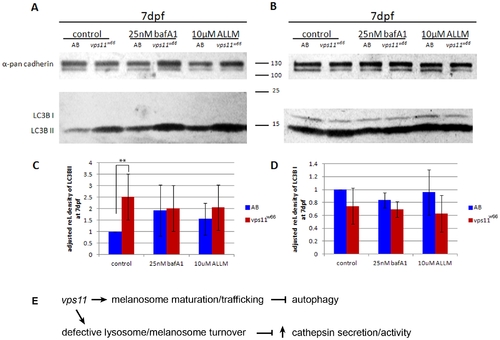
Baf A1 and ALLM treatment restore melanophore morphology and survival using an autophagy independent mechanism. A, B) Immunoblot analysis of LC3B II (A) and I (B) bands in control, Baf A1 and ALLM treated larvae lysates. A significant increase is detected in LC3B II in vps11w66 larvae. We did not consistently observe an increase under Baf A1 and ALLM treatment conditions (see densitometry analysis). LC3B I levels were lower in mutants across treatments but not significantly different from control (1% DMSO or 0.01% ETOH) fish. Anti-pan cadherin was used as a loading control. C, D) Graphical representation of density analysis of LC3B II and LC3B I bands, respectively, from three immunoblots using Image J. Samples were analyzed via one way ANOVA with Bonferonni multiple comparison analysis (p<0.001**). Error bars are standard deviation. E) Model for vps11 function in melanosome maturation, trafficking and integrity. We propose that vps11 functions at dual locations to promote melanophore morphology and survival: 1) During melanogenesis to promote endosome/melanosome fusion and correct melanosome trafficking and maturation. 2) During autophagy to promote melanosome/lysosome/autophagosome fusion. When fusion does not occur at the latter step, organelle accumulation leads to the compromise of melanosome (and/or lysosome) integrity leading to increased cathepsin secretion and/or activity. PHENOTYPE:
|