
- Title
-
Heterozygous inactivation of tsc2 enhances tumorigenesis in p53 mutant zebrafish
- Authors
- Kim, S.H., Kowalski, M.L., Carson, R.P., Bridges, L.R., and Ess, K.C.
- Source
- Full text @ Dis. Model. Mech.
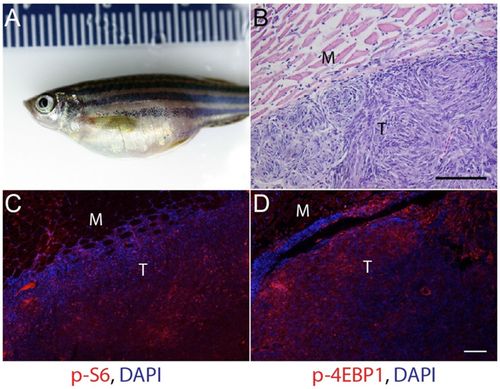
mTORC1 signaling in malignant abdominal tumors in p53zdf1/zdf1 zebrafish. (A) 1-year-old p53zdf1/zdf1 mutant fish with prominent abdominal tumor. (B) Hematoxylin and eosin (H&E) staining of a section from an abdominal tumor showing whorls of spindle-shaped cells consistent with an invasive sarcoma. (C,D) Increased expression of mTORC1 downstream effectors phospho-S6 (C) and phospho-4EBP1 (D) in abdominal tumors from p53zdf1/zdf1 zebrafish. For C and D, red fluorescence is immunosignal and blue is DAPI nuclear stain. M, muscle; T, tumor. Scale bars: 100 μm. Similar findings were seen in abdominal tumors from 10/10 p53zdf1/zdf1 zebrafish. |
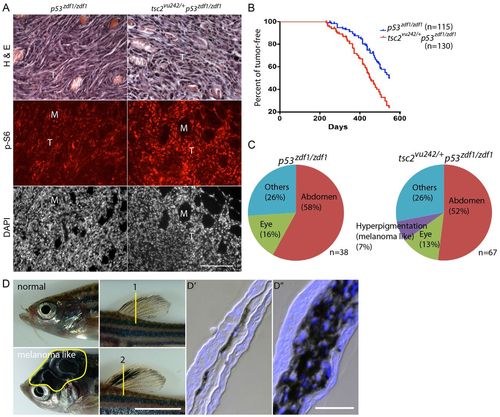
Increased mTORC1 signaling, enhanced tumorigenesis and altered tumor spectrum from the addition of a tsc2 heterozygous allele to a p53zdf1/zdf1 background. (A) H&E, phospho-S6 and DAPI (nuclei) staining of abdominal tumors from p53zdf1/zdf1 and tsc2;p53 compound mutant zebrafish. Left panels: invasive region of a p53zdf1/zdf1 tumor; right panels: tsc2;p53 compound mutant tumor. Circular structures are skeletal muscle bundles encircled by invasive tumor cells (pink in the H&E staining, but dark areas in the immunofluorescence images). Phospho-S6 signal is red and DAPI is white. M, muscle; T, tumor. Scale bar: 100 μm. (B) Kaplan-Meier tumor-free survival. Blue line is p53zdf1/zdf1 zebrafish, red line is tsc2;p53 compound mutant zebrafish. 50% of p53zdf1/zdf1 zebrafish had tumors at <550 days of life compared with 450 days for tsc2;p53 compound mutant zebrafish. n=115 and 130, respectively. This reduction in latency to tumor detection was statistically significant using the Log-rank test (P<0.0001). (C) Spectrum of tumor types from p53zdf1/zdf1 and tsc2;p53 compound mutant zebrafish. Tumor types were broadly similar with the exception of melanoma-like tumors, which were seen only in tsc2;p53 compound mutant zebrafish. (D) Normal zebrafish head and dorsal fin in the top panels and melanoma-like tumors on the head and dorsal fin in the bottom panels. Dorsal fins were sectioned at the region marked ‘1’ (normal) and ‘2’ (tumor) and stained with DAPI in D2 and D3, respectively. Scale bars: 5 mm (D); 100 μm (D3). |
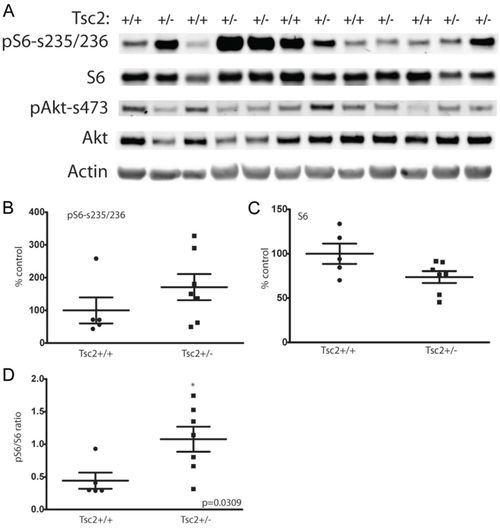
Increased mTORC1 signaling in tumors arising from tsc2;p53 compound mutant zebrafish compared with p53zdf1/zdf1 zebrafish. (A) Immunoblotting of a series of abdominal tumors comparing p53zdf1/zdf1 mutant zebrafish (lanes marked Tsc2+/+) and tsc2;p53 compound mutants (lanes marked Tsc2+/). (B) Quantification of phospho-S6 levels were normalized to actin expression (P=0.25). (C) Quantification of total S6 levels were normalized to actin expression (P=0.06). (D) Increased ratio of normalized phospho-S6 to total S6 levels in tsc2;p53 compound mutant compared with p53zdf1/zdf1 zebrafish; asterisk denotes significance by two-tailed Student’s t-test, P=0.03. n=5 for p53 mutant and n=7 for compound mutant zebrafish, although two tumor samples from tsc2;p53 compound mutant zebrafish (lanes 4,5 and 11,12) were divided in half and processed independently for immunoblotting. |
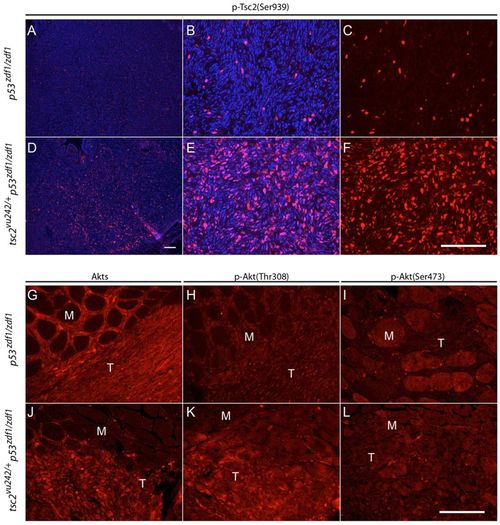
AKT activity in p53zdf1/zdf1 and tsc2;p53 compound mutant tumors. (A–F) Phospho-tuberin (p-Tsc2) staining in p53zdf1/zdf1 and tsc2;p53 compound mutant zebrafish. (B,C and E,F) Higher magnification of A and D, respectively. (C,F) Phospho-tuberin (Ser939, red); (B,E) phospho-tuberin (red) merged with DAPI (blue). (G,J) Total Akt immunofluorescence, (H,K) phospho-Akt (Thr308) immunofluorescence and (I,L) phospho-Akt (Ser473) immunofluorescence in p53zdf1/zdf1 (G–I) and tsc2;p53 compound mutant (J–L) zebrafish. M, muscle; T, tumor. Scale bars: 100 μm. EXPRESSION / LABELING:
|
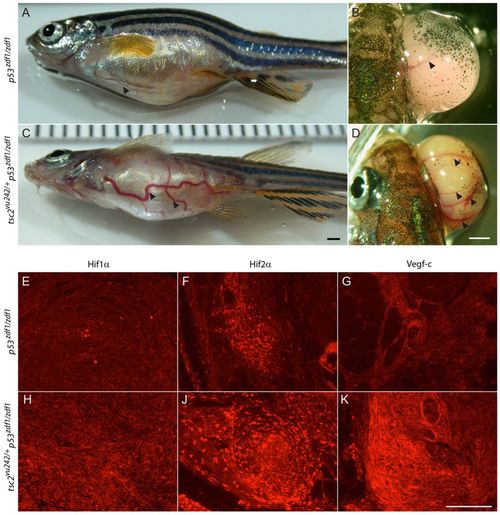
Angiogenesis and increased expression of angiogenic factors in tumors from tsc2;p53 compound mutant zebrafish. (A,B) Arrowheads indicate visible blood vessels on tumors from abdomen (A) and eye (B) from p53zdf1/zdf1 zebrafish (n=8/16). (C,D) Arrowheads indicate large and tortuous blood vessels observed in abdomen (C) and eye (D) tumors from tsc2;p53 compound mutant (n=17/25) zebrafish. Scale bars: 1 mm. (E,H) Hif1-α staining, (F,J) Hif2-α staining and (G,K) Vegf-c staining in p53zdf1/zdf1 (E–G) and tsc2;p53 compound mutant (H–K) zebrafish. Scale bar: 100 μm. |
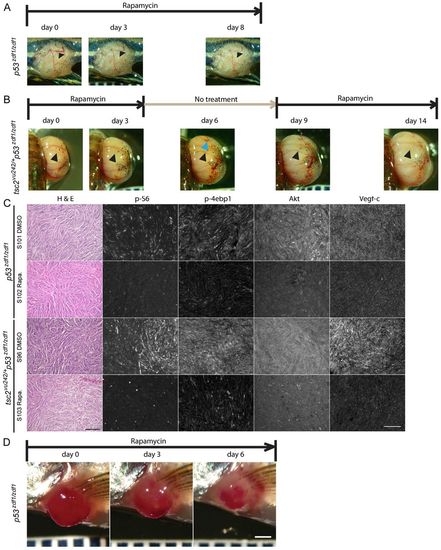
Rapamycin treatment reduced blood vessel caliber in tumors from p53zdf1/zdf1 and tsc2;p53 compound mutant zebrafish. (A,B) Representative tumors from rapamycin-treated fish. (A) Rapamycin treatment of p53zdf1/zdf1 zebrafish harboring a tumor in its trunk. Arrowheads indicate visible vascular structure on the tumor surface. (B) Rapamycin treatment cycle (on day 0 to 3, 9 to 14, off day 4 to 8) lasting 2 weeks in a compound mutant zebrafish with an expending eye tumor. Pictures were taken at indicated days. Black arrowheads indicate vascular structures that disappeared during rapamycin treatment. Blue arrowhead indicates apparent new vessels formed during the rapamycin-off period. (C) H&E staining, and phospho-S6, phospho-4EBP1, Akt and Vegf-c expression (antibody signal shown as white) in p53zdf1/zdf1 and tsc2;p53 compound mutant abdomen tumors treated with DMSO or rapamycin for 2 days (n=3). Scale bar: 100 μm. (D) Rapamycin shrinks tumors in p53zdf1/zdf1 zebrafish. A representative angioma-like tumor was seen near the pectoral fin and treated daily with rapamycin. After 3 days of treatment, a clear decrease in size was noted. The tumor continued to shrink over the 1 week total period of rapamycin treatment. Scale bar: 1 mm. |
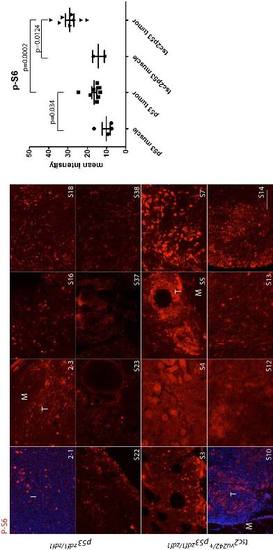
Phospho-S6 staining (red) in a series of abdominal tumors from p53zdf1/zdf1 and tsc2;p53S compound mutant zebrafish tumors. (Left) 8 tumor samples per each line were used for comparison. (Right) Mean values of intensity (arbitrary units) were graphed. M, muscle; T, tumor. Scale bar = 100 μm. Student’s t-test was used to assess statistical significance. EXPRESSION / LABELING:
|

Phospho-tuberin Ser939 staining (red) in a series of abdominal tumors from p53zdf1/zdf1 and tsc2;p53 compound mutant zebrafish. (Left) 8 tumor samples per each line were used for comparison. (Right) Mean values of intensity (arbitrary units) were graphed. M, muscle; T, tumor. Scale bar = 100 μm. Student’s t-test was used to assess statistical significance. EXPRESSION / LABELING:
|
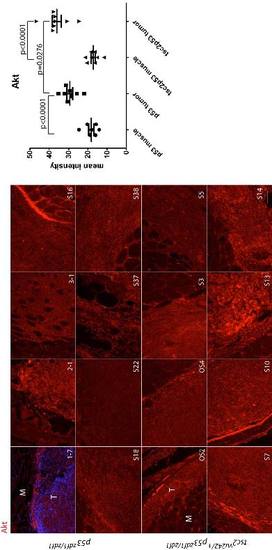
Total Akt staining (red) in a series of abdominal tumors from p53zdf1/zdf1 and tsc2;p53 compound mutant zebrafish. (Left) 8 tumor samples per each line were used for comparison. (Right) Mean values of intensity (arbitrary units) were graphed. M, muscle; T, tumor. Scale bar = 100 μm. Student’s t-test was used to assess statistical significance. |

Phospho-Akt Thr308 (red) staining in a series of abdominal tumors from p53zdf1/zdf1 and tsc2;p53 compound mutant zebrafish. (Left) 8 tumor samples per each line were used for comparison. (Right) Mean values of intensity (arbitrary units) were graphed. M, muscle; T, tumor. Scale bar = 100 μm. Student’s t-test was used to assess statistical significance. EXPRESSION / LABELING:
|
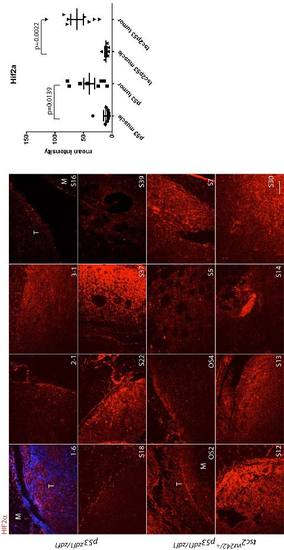
Hif2a staining (red) in a series of abdominal tumors from p53zdf1/zdf1 and tsc2;p53 compound mutant zebrafish. (Left) 8 tumor samples per each line were used for comparison. (Right) Mean values of intensity (arbitrary units) were graphed. M, muscle; T, tumor. Scale bar = 100 μm. Student’s t-test was used to assess statistical significance. EXPRESSION / LABELING:
|
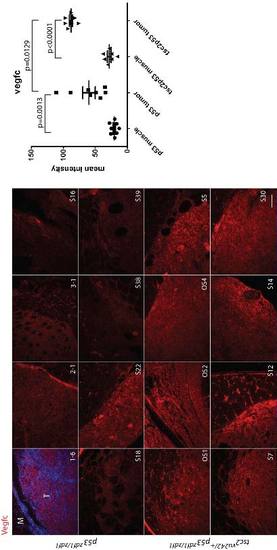
Vegf-c staining (red) in a series of abdominal tumors from p53zdf1/zdf1 and tsc2;p53 compound mutant zebrafish. (Left) 8 tumor samples per each line were used for comparison. (Right) Mean values of intensity (arbitrary units) were graphed. M, muscle; T, tumor. Scale bar = 100 μm. Student’s t-test was used to assess statistical significance. EXPRESSION / LABELING:
|

Increased size of blood vessels in the liver of tsc2 homozygous mutant zebrafish. The tsc2 mutant allele was crossed to transgenic fish expressing EGFP under the Fli1 promoter that directs expression in endothelial cells. Examples shown are liver from 7 day old larvae. Above images are wildtype (wt) control, below are tsc2 homozygous mutant sections. Left images are Fli1:EGFP, and right images hematoxylin and eosin staining. Asterisks (yellow in Fli1:EGFP, black in hematoxylin and eosin stain) denote the blood vessel lumen. Scale bar = 100 μm. PHENOTYPE:
|
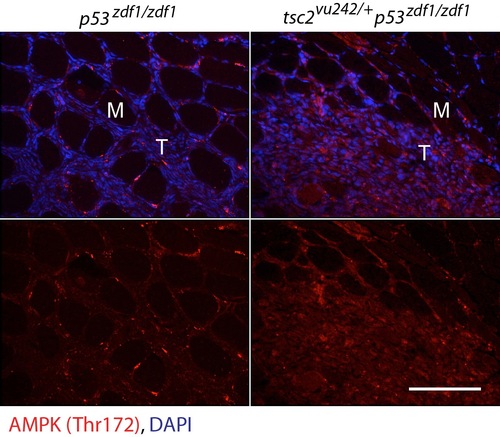
AMPK Thr172 staining (red) and DAPI (blue) in abdominal tumors from p53zdf1/zdf1 and tsc2;p53 compound mutant zebrafish. Merged colors above and AMPK Thr172 alone shown below. M, muscle; T, tumor. Scale bar = 100 μm. EXPRESSION / LABELING:
|