
IMAGE
Fig. 5
- ID
- ZDB-IMAGE-130909-14
- Antibodies
- Publication
- Kim et al., 2013 - Heterozygous inactivation of tsc2 enhances tumorigenesis in p53 mutant zebrafish
- All Figures
- Figures for Kim et al., 2013
Image
|
Figure Caption
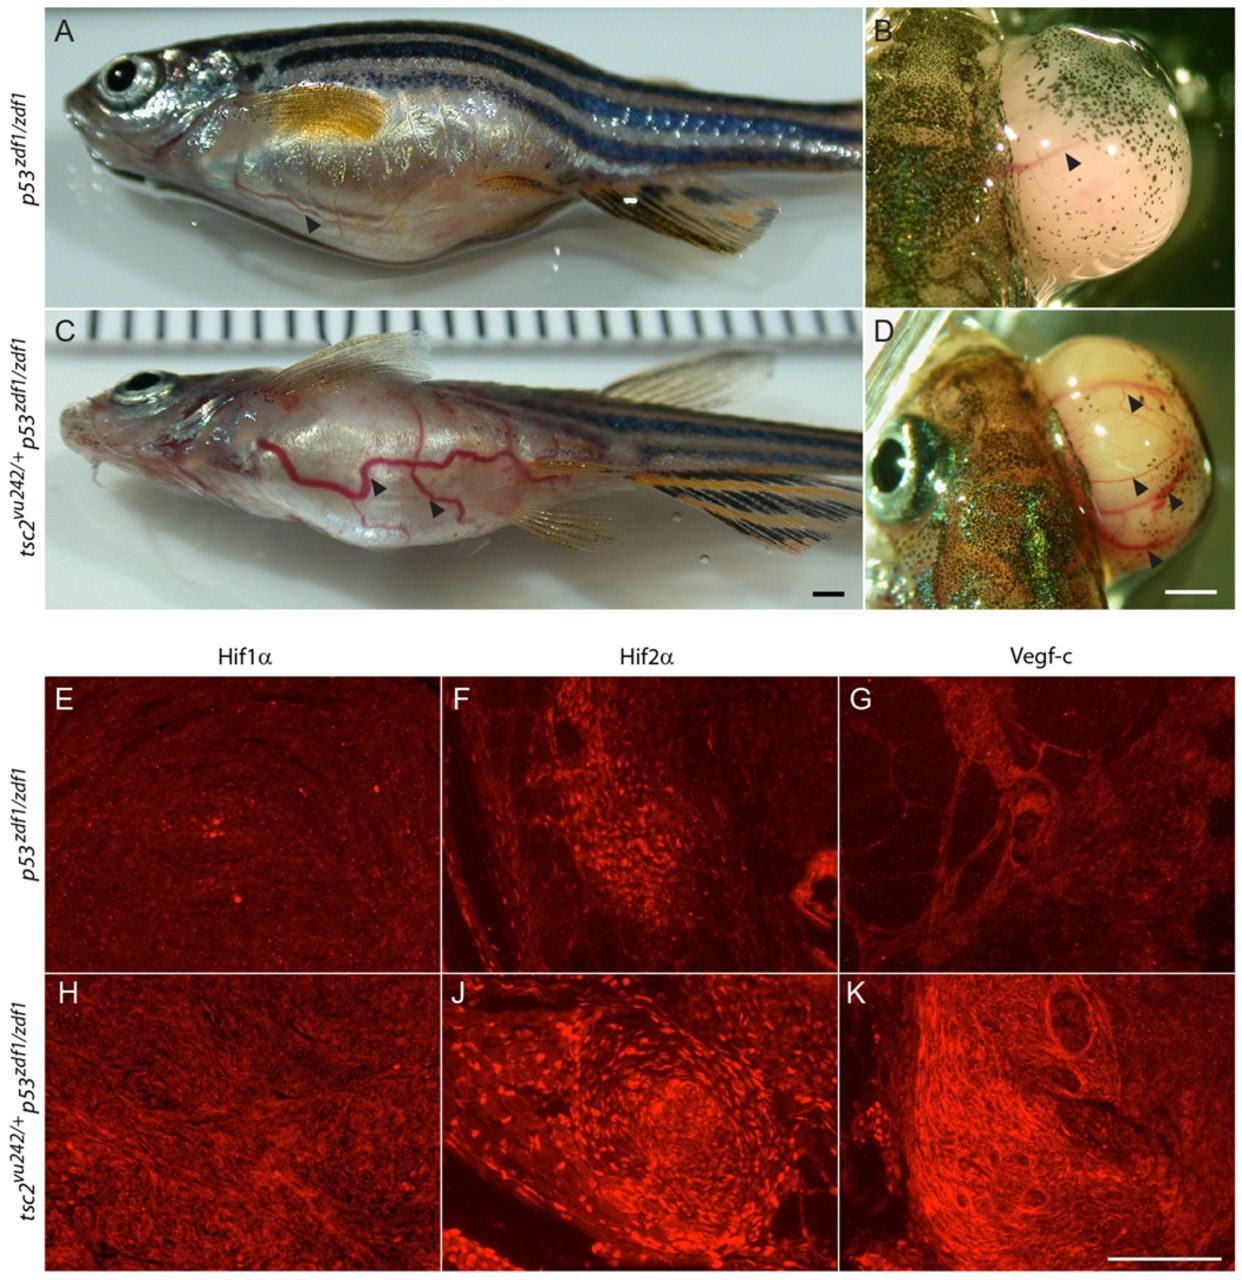
Fig. 5
Angiogenesis and increased expression of angiogenic factors in tumors from tsc2;p53 compound mutant zebrafish. (A,B) Arrowheads indicate visible blood vessels on tumors from abdomen (A) and eye (B) from p53zdf1/zdf1 zebrafish (n=8/16). (C,D) Arrowheads indicate large and tortuous blood vessels observed in abdomen (C) and eye (D) tumors from tsc2;p53 compound mutant (n=17/25) zebrafish. Scale bars: 1 mm. (E,H) Hif1-α staining, (F,J) Hif2-α staining and (G,K) Vegf-c staining in p53zdf1/zdf1 (E–G) and tsc2;p53 compound mutant (H–K) zebrafish. Scale bar: 100 μm.
Figure Data
Acknowledgments
This image is the copyrighted work of the attributed author or publisher, and
ZFIN has permission only to display this image to its users.
Additional permissions should be obtained from the applicable author or publisher of the image.
Full text @ Dis. Model. Mech.