- Title
-
Developmental time rather than local environment regulates the schedule of epithelial polarization in the zebrafish neural rod
- Authors
- Girdler, G.C., Araya, C., Ren, X., and Clarke, J.D.
- Source
- Full text @ Neural Dev.
|
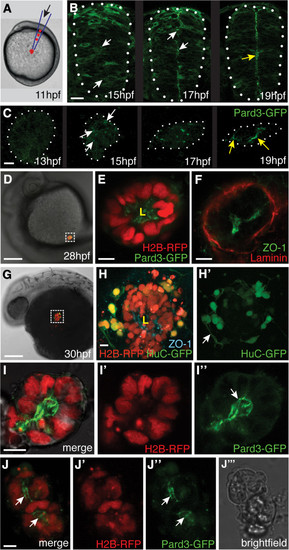
Neural cells polarize on time in ectopic locations in the embryo. (A) Schematic illustrating transplantation of 20 to 30 cells to the lateral surface of the yolk of a host embryo at 11 hours post fertilization (hpf). (B) Frames taken from a timelapse movie of a wild-type embryo showing the stages of green fluorescent protein/polarity protein partitioning defective 3 fusion (Pard3-GFP) polarization in the neural rod in transverse view (white dots outline the rod). White arrows indicate puncta of Pard3-GFP, yellow arrow indicates the apical surface expression of Pard3-GFP at the midline. Scale bar is 25 µm. (C) Maximum confocal projections of an ectopic cluster of cells from a timelapse movie showing similar timing of Pard3-GFP polarization to the neural rod (white dots outline the cluster). White arrows indicate puncta of Pard3-GFP, yellow arrows indicate strong Pard3-GFP coalescence at the cluster center. Scale bar is 10 µm. See also Additional file 1: Movie S1. (D) Ectopically transplanted cell clusters remain in an ectopic location at 28 hpf. Scale bar is 100 µm. (E) Magnification of the boxed region in D shows Pard3-GFP (green) is polarized to the center of cluster and marks a single lumen (L). Scale bar is 10 µm. (F) Zonula occludens 1 (ZO-1) (green) is located at the center of ectopic cluster outlining the lumen surface. The basal lamina component laminin (red) surrounds the cluster. Scale bar is 10 µm. (G) Ectopically transplanted cell cluster at 30 hpf. Scale bar is 100 µm. (H) Magnification of the boxed region in G. Neurons labeled with HuC-GFP (green) are present at the edge of the cluster and ZO-1 (cyan) demarcates a lumen (L) at the center of cluster. Arrow in (H′) points to neuronal processes. Scale bar is 10 µm. (I) A projection of z-slices though the center of a cluster of neuroepithelial cells expressing histone H2B/red fluorescent protein fusion (H2B-RFP) (I′) and Pard3-GFP (I′′) cultured in Matrigel until 28 hpf. Pard3-GFP outlines a single central lumen (arrow in (I′′)). (J-J′′) A projection of z-slices though the center of a second cluster of neuroepithelial cells in Matrigel expressing H2B-RFP and Pard3-GFP with two lumens (white arrows). Scale bar indicates 10 µm. (J′′′) Bright-field image of the cluster in (J). |
|
Heterochronic transplanted cells polarize according to their own age rather than the host schedule. (A) Schematic of isochronic and heterochronic cell transplantation strategy. (B) Isochronic transplanted cells integrate into the host neural tube and display the typical morphology of neuroepithelial cells at 24 hours post fertilization (hpf). (C) Green fluorescent protein/polarity protein partitioning defective 3 fusion (Pard3-GFP) is largely cytoplasmic in non-transplanted neural rod cells at 15 hpf, although there are a few small puncta at the developing midline (arrowheads). (D) Pard3-GFP is localized to the midline in non-transplanted neural rod cells at 18 hpf. (E) Isochronic transplanted cells at 15 hpf show Pard3-GFP localization typical of their age (compare to (C)), with some small puncta of Pard3-GFP (arrowheads). (F) Isochronic transplanted cells at 18 hpf show strong midline Pard3-GFP polarization, typical of their age (compare to (D)). (G) Dorsal view of 15 hpf host embryo (green nuclei) containing old (18 hpf) cells (red nuclei). Tissue has been stained for zonula occludens 1 (ZO-1) immunoreactivity (white) revealing high levels of ZO-1 expression adjacent to old cells (bracket) and low levels in regions containing only host cells. White arrows indicate neural midline. Yellow arrow indicates an isolated donor nucleus. (H) Pard3-GFP expression in isolated cells, transplanted isochronically (old into old and young into young) or heterochronically (old into young and young into old). White dots indicate basal surface. Scale bar 20 µm. (I) Quantification of Pard3-GFP polarization in isochronic and heterochronic cells. n, number of cells; ns, not significant; *P <0.01, Fishers test. |
|
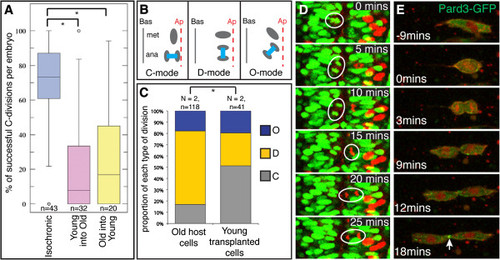
The mode of cell division is regulated by intrinsic programs, not environmental influences. (A) Quantification of midline crossing for isochronic and heterochronic cells; *P <0.01, KS test. n = number of embryos. (B) Schematic illustrating the three different modes of cell division orientation that occur at neural rod and tube stages. (C) Quantification of the mode of cell divisions for older host cells and younger transplanted cells. A significantly greater proportion of younger transplanted cells divide with a C-mode of division orientation compared to older host cells; *P <0.01, Χ2 test. (D) Series of frames from a timelapse movie to illustrate a young cell (circled red nucleus) dividing with a C-division orientation, and a neighboring host cell (circled green nucleus) dividing with a D-division orientation. See also Additional file: Movie S3. (E) Sequence of timelapse frames of an old cell expressing green fluorescent protein/polarity protein partitioning defective 3 fusion (Pard3-GFP) transplanted into young host. During cytokinesis Pard3-GFP is localized to the abscission plane (arrowed) as is typical of cells at neural rod stages but not at earlier stages of development. |
|
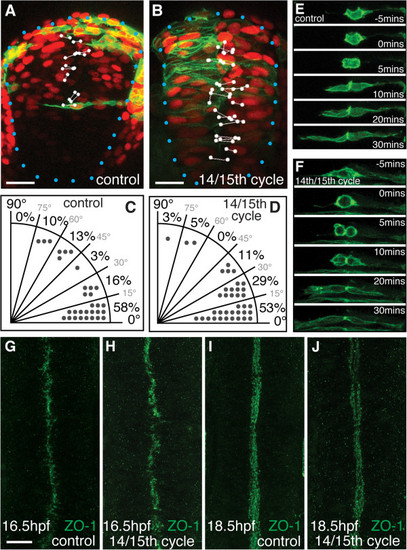
Neural progenitors do not count the number of cell cycles to measure time. (A,B) Most 16th cycle cell divisions in control embryos occur close to the midline with a mediolateral orientation. In a 14th/15th cycle embryo, most cells in the neural rod still divide close to the midline with a mediolateral orientation. The larger nuclei in the 14th/15th cycle embryos confirm that cells have undergone fewer divisions than controls. White dots indicate location of anaphase nuclei and the lines indicate division orientation. Blue dots outline edge of neural rod. Scale bar is 25 µm. (C,D) Quantification of cell division orientation in the neural rod of control ((C), n = 29) and 14th/15th cycle ((D), n = 38) embryos. An angle of 0° represents a mediolateral separation of daughter cell nuclei. An angle of 90° represents dorsoventral oriented separation of daughter cell nuclei during mitosis. (E,F) Timelapse frames from a control (E) or 14th/15th cycle (D) embryo. For both divisions, the cell rounds up and divides with a mediolateral orientation close to the midline at t = 0, and sister cells then separate across the midline by t = 30 minutes. (G-J) Dorsal view confocal projections through the hindbrain of zonula occludens 1 (ZO-1) staining in control or 14th/15th cycle embryos. At 16.5 hours post fertilization (hpf), ZO-1 is localized to the midline of the neural rod in control (G) and 14th/15th cycle (H) embryos. At 18.5 hpf, ZO-1 outlines the apical surface of the neural tube, and the ventricle has begun to open both in control (I) embryos and 14th/15th cycle (J) embryos. Scale bar is 25 µm in all figures. |
|
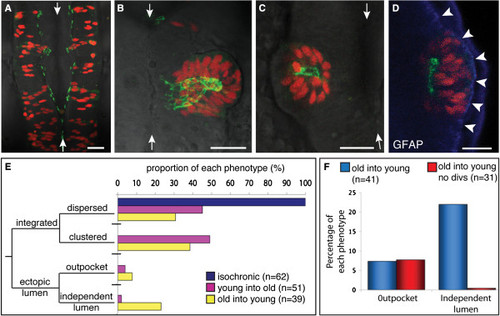
Heterochronic transplanted cells integrate into the host neuroepithelium, and can generate ectopic lumen surfaces. (A-D) Dorsal view projected confocal z-series of transplanted cells in the host hindbrain at 24 hours post fertilization (hpf). White arrows indicate the midline of neural tube. Scale bar is 25 µm. (A) By 24 hpf, isochronic transplanted cells have established apicobasal polarity, as revealed by green fluorescent protein/polarity protein partitioning defective 3 fusion (Pard3-GFP) localization at the ventricular surface of the neuroepithelium. (B) Heterochronic transplanted cells can generate ectopic apical surfaces that form an outpocket of the host neuroepithelium. (C) Heterochronic transplanted cells can form rosettes with a lumen independent of the host lumen. (D) Glial fibrillary acidic protein (GFAP) (blue) staining confirms that an ectopic rosette of transplanted cells is located within the neuroepithelium. Arrowheads show lateral edge of neural tube. (E) Frequency histogram showing the proportion of isochronic and heterochronic transplanted cells that fall into the four phenotypes of integrated dispersed, integrated clustered, ectopic lumen outpocket or independent lumen. (F) Graph showing that blocking cell division abolishes formation of independent lumens in old into young transplants. |


