
Fig. 4
- ID
- ZDB-IMAGE-150427-4
- Publication
- Girdler et al., 2013 - Developmental time rather than local environment regulates the schedule of epithelial polarization in the zebrafish neural rod
- All Figures
- Figures for Girdler et al., 2013
|
Fig. 4
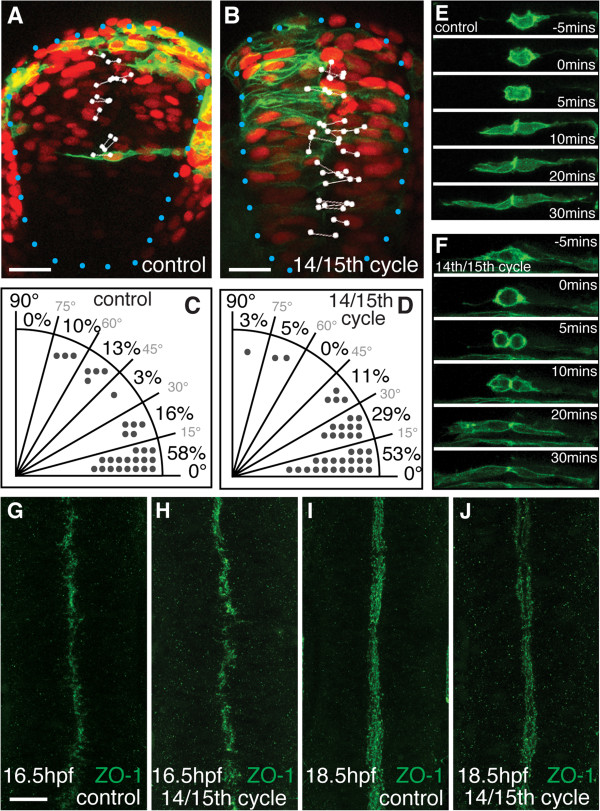
Neural progenitors do not count the number of cell cycles to measure time. (A,B) Most 16th cycle cell divisions in control embryos occur close to the midline with a mediolateral orientation. In a 14th/15th cycle embryo, most cells in the neural rod still divide close to the midline with a mediolateral orientation. The larger nuclei in the 14th/15th cycle embryos confirm that cells have undergone fewer divisions than controls. White dots indicate location of anaphase nuclei and the lines indicate division orientation. Blue dots outline edge of neural rod. Scale bar is 25 µm. (C,D) Quantification of cell division orientation in the neural rod of control ((C), n = 29) and 14th/15th cycle ((D), n = 38) embryos. An angle of 0° represents a mediolateral separation of daughter cell nuclei. An angle of 90° represents dorsoventral oriented separation of daughter cell nuclei during mitosis. (E,F) Timelapse frames from a control (E) or 14th/15th cycle (D) embryo. For both divisions, the cell rounds up and divides with a mediolateral orientation close to the midline at t = 0, and sister cells then separate across the midline by t = 30 minutes. (G-J) Dorsal view confocal projections through the hindbrain of zonula occludens 1 (ZO-1) staining in control or 14th/15th cycle embryos. At 16.5 hours post fertilization (hpf), ZO-1 is localized to the midline of the neural rod in control (G) and 14th/15th cycle (H) embryos. At 18.5 hpf, ZO-1 outlines the apical surface of the neural tube, and the ventricle has begun to open both in control (I) embryos and 14th/15th cycle (J) embryos. Scale bar is 25 µm in all figures.