Fig. 1
- ID
- ZDB-FIG-150427-1
- Publication
- Girdler et al., 2013 - Developmental time rather than local environment regulates the schedule of epithelial polarization in the zebrafish neural rod
- Other Figures
- All Figure Page
- Back to All Figure Page
|
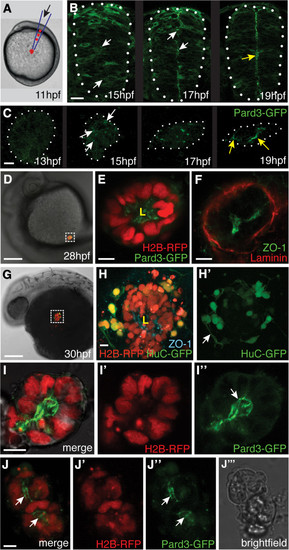
Neural cells polarize on time in ectopic locations in the embryo. (A) Schematic illustrating transplantation of 20 to 30 cells to the lateral surface of the yolk of a host embryo at 11 hours post fertilization (hpf). (B) Frames taken from a timelapse movie of a wild-type embryo showing the stages of green fluorescent protein/polarity protein partitioning defective 3 fusion (Pard3-GFP) polarization in the neural rod in transverse view (white dots outline the rod). White arrows indicate puncta of Pard3-GFP, yellow arrow indicates the apical surface expression of Pard3-GFP at the midline. Scale bar is 25 µm. (C) Maximum confocal projections of an ectopic cluster of cells from a timelapse movie showing similar timing of Pard3-GFP polarization to the neural rod (white dots outline the cluster). White arrows indicate puncta of Pard3-GFP, yellow arrows indicate strong Pard3-GFP coalescence at the cluster center. Scale bar is 10 µm. See also Additional file 1: Movie S1. (D) Ectopically transplanted cell clusters remain in an ectopic location at 28 hpf. Scale bar is 100 µm. (E) Magnification of the boxed region in D shows Pard3-GFP (green) is polarized to the center of cluster and marks a single lumen (L). Scale bar is 10 µm. (F) Zonula occludens 1 (ZO-1) (green) is located at the center of ectopic cluster outlining the lumen surface. The basal lamina component laminin (red) surrounds the cluster. Scale bar is 10 µm. (G) Ectopically transplanted cell cluster at 30 hpf. Scale bar is 100 µm. (H) Magnification of the boxed region in G. Neurons labeled with HuC-GFP (green) are present at the edge of the cluster and ZO-1 (cyan) demarcates a lumen (L) at the center of cluster. Arrow in (H′) points to neuronal processes. Scale bar is 10 µm. (I) A projection of z-slices though the center of a cluster of neuroepithelial cells expressing histone H2B/red fluorescent protein fusion (H2B-RFP) (I′) and Pard3-GFP (I′′) cultured in Matrigel until 28 hpf. Pard3-GFP outlines a single central lumen (arrow in (I′′)). (J-J′′) A projection of z-slices though the center of a second cluster of neuroepithelial cells in Matrigel expressing H2B-RFP and Pard3-GFP with two lumens (white arrows). Scale bar indicates 10 µm. (J′′′) Bright-field image of the cluster in (J). |

