
- Title
-
Apical Targeting and Endocytosis of the Sialomucin Endolyn are Essential for Establishment of Zebrafish Pronephric Kidney Function
- Authors
- Mo, D., Ihrke, G., Costa, S.A., Brilli, L., Labilloy, A., Halfter, W., Cosentino, C.C., Hukriede, N.A., and Weisz, O.A.
- Source
- Full text @ J. Cell Sci.
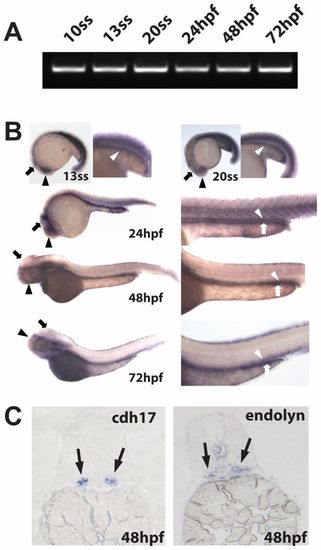
Endolyn is expressed in the zebrafish kidney, brain and digestive system. (A) RT-PCR analysis of RNA extracted from embryos at the indicated stages was performed using specific primers against endolyn. All lanes show a band of the expected size (~600 bp). (B) In situ hybridization for endolyn in embryos was performed at 13ss and 20ss and at 24, 48, 72 hpf. Kidney (white arrowhead), brain (black arrow) and eye (black arrowhead) staining are evident by the 13ss stage and staining of the digestive system (white arrow) appears by 24 hpf. (C) Cross sections through the proximal tubule of zebrafish embryos at 48 hpf (5µm) were stained by in situ hybridization using probes to cadherin 17 (cdh17), a pronephric marker, or endolyn. Endolyn staining coincided with that of cadherin 17 in the expected region, confirming endolyn localization in the pronephric kidney. EXPRESSION / LABELING:
|
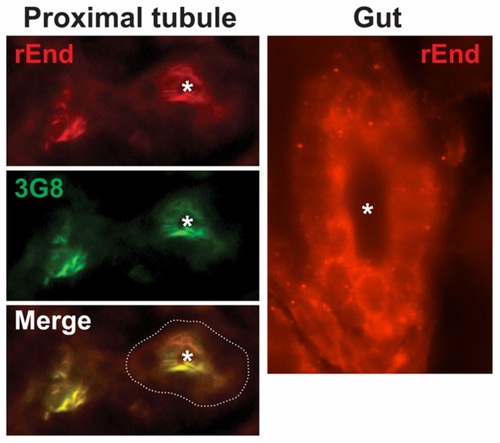
Rat endolyn is targeted to the apical surface of the zebrafish proximal tubule. mRNA encoding wild-type rat endolyn (200ng) was injected into zebrafish embryos at the one-cell stage. Embryos were fixed at 48 hpf, sectioned and incubated with polyclonal anti-rat endolyn (rEnd) and monoclonal 3G8 antibodies (to mark the apical surface of proximal tubules) as described in Materials and Methods. Cross sections through the proximal tubule and gut are shown. The periphery of the proximal tubule is outlined in the merged image and the lumen is marked by an asterisk. EXPRESSION / LABELING:
|
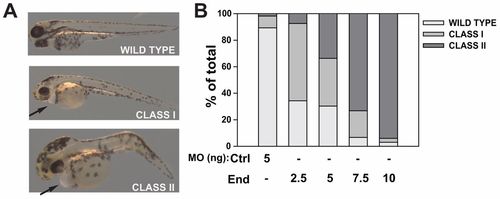
Endolyn morphants develop pericardial edema, hydrocephaly, and body curvature. (A) Zebrafish larvae were imaged 48 hpf after endolyn MO injection and classified as wild type (no visible pericardial edema or body curvature), moderately affected (Class I: frank pericardial edema, visible body curvature, hydrocephaly) and severely affected or dead (Class II: severe pericardial edema, body curvature, severe hydrocephaly). Representative images from each class are shown. (B) The distribution of observed phenotypes at 48 hpf in embryos injected with control (Ctrl) MO or the indicated doses of endolyn (End) MOs is graphed. Endolyn knockdown elicits concentration-dependent effects on larval edema and survival. Three independent injections were quantified with 50 or more injected embryos per condition in each experiment. PHENOTYPE:
|
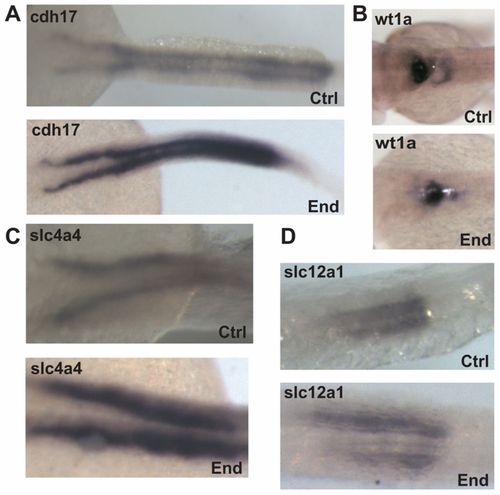
Kidney morphology is intact after endolyn knockdown. (A) In situ hybridization was performed at 48 hpf to detect cdh17 expression in embryos injected with either control (Ctrl) or endolyn (End) MOs. (B-D) In situ hybridization was performed at 48 hpf in embryos injected with either control or endolyn MO to detect markers for podocytes (wt1a) (B), proximal tubule (slc4a4) (C), and distal tubule (slc12a1) (D). The morphology of the pronephric kidney in morphants is not grossly disrupted, although the tubules appear dilated. Class I morphants were used in all experiments. |
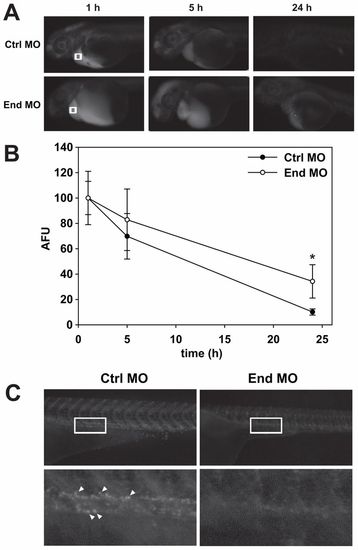
Pronephric kidney function is disrupted in endolyn morphants. (A) 1ng of 10kDa rhodamine-dextran was injected into the common cardinal vein of control (Ctrl) or endolyn (End) morphants at 48 hpf. Images were acquired under identical conditions at 1, 5 and 24h post-injection. (B) The loss of fluorescence over time near the common cardinal vein (regions marked by white boxes in A) was quantified, normalized to the initial fluorescence observed at 1h, and plotted. Three independent injections were quantified with at least ten Class I and control embryos injected in each experiment. At 24h, retained fluorescence is significantly greater in endolyn morphants compared with controls (*P = 0.001 by Mann–Whitney rank sum test). (C) Imaging of the pronephric proximal tubule 24h after injection of 70kDa rhodamine-dextran demonstrates impaired endocytosis in endolyn morphants. Bottom panels show enlarged regions of the areas delineated by white rectangles in the corresponding upper panels. Arrowheads point to examples of endocytic vesicles in control larvae. |