
- Title
-
Reprogramming capacity of Nanog is functionally conserved in vertebrates and resides in a unique homeodomain
- Authors
- Theunissen, T.W., Costa, Y., Radzisheuskaya, A., van Oosten, A.L., Lavial, F., Pain, B., Castro, L.F., and Silva, J.C.
- Source
- Full text @ Development
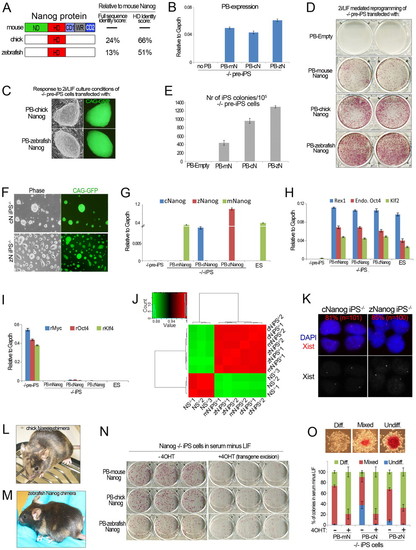
Vertebrate Nanog orthologs induce naive pluripotency. (A) Structural alignment of mNanog with non-mammalian Nanog ortholog proteins. Identity scores between full-length proteins or homeodomain (HD) only are indicated on the right. The identity scores were calculated using ClustalW2. ND, N-terminal domain; CD1, C-terminal domain 1; WR, tryptophan repeat; CD2, C-terminal domain 2. (B) qRT-PCR analysis for expression of the piggyBac (PB) sequence in Nanog–/– pre-iPS cells transfected with mouse (m), chick (c) or zebrafish (z) Nanog (N) PB. Data are relative levels. Error bars indicate 1 s.d. (C) Phase contrast and GFP images of emerging Nanog–/– iPS cell colonies. (D) Alkaline phosphatase (AP) staining of emerging Nanog–/– iPS cell colonies. (E) Quantification of the total number of AP-positive iPS cell colonies. Data are mean values. Error bars indicate 1 s.d. (n=2). (F) Phase contrast and GFP images of Nanog–/– iPS cells generated with cNanog or zNanog. (G) qRT-PCR analysis confirming the presence of cNanog or zNanog transcript in cNanog iPS–/– cells and zNanog iPS–/– cells, respectively. This panel only serves to verify the expression of the intended ortholog. Relative expression levels from different Taqman assays cannot be cross-compared. Quantification of total PB transgene expression in these samples is provided in Fig. 3H. Data are relative levels. Error bars indicate 1 s.d. (H,I) qRT-PCR analysis for pluripotent gene (H) and retroviral (r) transgene (I) expression in Nanog–/– pre-iPS cells, mNanog, cNanog and zNanog iPS–/– cells, and ES cells. Data are relative levels. Error bars indicate 1 s.d. (J) Correlation heatmap of global gene expression between Nanog–/– NS cells, mNanog (mN) iPS–/– cells, cNanog (cN) iPS–/– cells and zNanog (zN) iPS–/– cells. Two biological replicates were included for each cell line. (K) RNA FISH for Xist in Nanog–/– iPS cells. (L,M) Adult chimeric mouse obtained after blastocyst injection of either cNanog iPS–/– cells (L) or zNanog iPS–/– cells (M) following Cre excision of the Nanog transgene. Agouti coat color indicates chimerism. (N) AP staining of mNanog, cNanog and zNanog iPS–/– cells plated at clonal density in serum minus LIF before and after tamoxifen-induced Cre excision of the PB transgene. (O) Quantification of the proportion of undifferentiated, mixed and differentiated colonies in each condition shown in N. Error bars indicate 1 s.d. (n=3). Representative examples of colonies in each category are shown. |
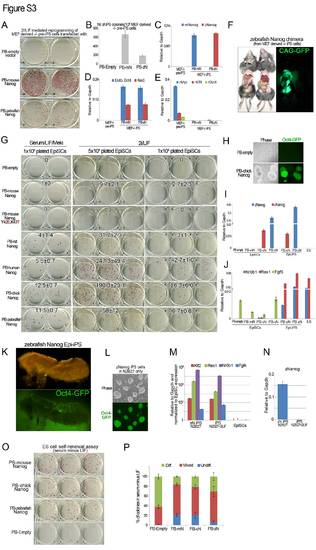
Vertebrate orthologs of Nanog induce naive pluripotency in multiple cell systems. (A) AP staining of Nanog-/- MEF-derived pre-iPS cells transfected with PB transgenes containing an empty vector, mNanog or zNanog, and subsequently cultured in 2i/LIF conditions for 10 days. (B) Quantification of the total number of AP-positive iPS cell colonies at day 10 after medium switch. Error bars indicate one s.d. (n=2). (C) qRT-PCR analysis confirming the presence of mNanog or zNanog transcript in MEF-derived iPS-/- cells generated with mNanog or zNanog. Error bars indicate 1s.d. (D) qRT-PCR analysis for endogenous pluripotency gene expression in MEF-derived iPS-/- cells generated with mNanog or zNanog. Error bars indicate 1 s.d. (E) qRT-PCR analysis for retroviral transgene expression in MEF-derived iPS-/- cells generated with mNanog or zNanog. Error bars indicate 1 s.d. (F) Adult chimeric mouse obtained after blastocyst injection of MEF-derived zNanog iPS-/- cells following Cre excision of the loxP-flanked Nanog transgene. GFP indicates iPS cell contribution. (G) AP staining of EpiSCs transfected with PB transgenes containing an empty vector, mNanog, mNanogY42E, K43T, rNanog, hNanog, cNanog or zNanog, and subsequently cultured for 10 days in presence of the MEK inhibitor PD0325901 and LIF or 2i/LIF. Average numbers of colonies in each condition are indicated. Error bars indicate 1 s.d. (H) Phase and GFP images of emerging iPS cell colonies during 2i/LIF induction of EpiSCs transfected with an empty vector or a cNanog PB transgene. Fluorescence indicates activation of the Oct4-GFP-ires-puro reporter transgene. (I) qRT-PCR analysis confirming the presence of zNanog or cNanog transcript in EpiSC-derived iPS cells generated with cNanog or zNanog. Error bars indicate 1 s.d. (J) qRT-PCR analysis of Nr0b1,Rex1 and Fgf5 expression in EpiSC-derived iPS cells generated with zNanog or cNanog. Error bars indicate 1 s.d. (K) Genital ridge from chimeric embryo dissected at E12.5 shows contribution of EpiSC-derived iPS cells generated with zNanog, which express an Oct4-GFP transgene, to the germline. (L) Phase and GFP images of iPS cells generated from EpiSCs with zNanog in serum-free medium with LIF, and subsequently passaged for 10 passages in serum-free medium alone. Fluorescence indicates activation of the Oct4-GFP-ires-puro reporter transgene. (M) qRT-PCR analysis of Klf2, Rex1, Nr0b1 and Fgf4 expression in iPS cells generated with zNanog in serum-free medium with LIF, and subsequently passaged for 10 passages in serum-free medium alone. Error bars indicate 1 s.d. (N) qRT-PCR analysis confirming zNanog expression in iPS cells generated with zNanog in serum-free medium with LIF, and subsequently passaged for 10 passages in serum-free medium alone. Error bars indicate 1 s.d. (O) AP staining of ES cells transfected with mNanog, cNanog and zNanog, and plated at clonal density in serum minus LIF. (P) Quantification of the proportion of undifferentiated, mixed and differentiated colonies in each condition shown in O. Error bars indicate 1 s.d. (n=3). Representative examples of colonies in each category are shown in Fig. 3M. |
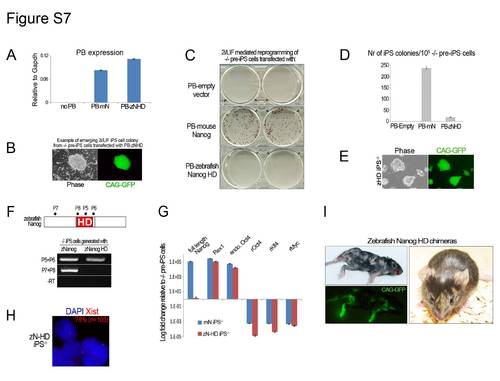
A small fragment that includes the homeodomain of zebrafish Nanog induces pluripotency. (A) qRT-PCR analysis for expression of the piggyBac (PB) transgene sequence in Nanog-/- pre-iPS cells transfected with an 81 amino acid fragment that includes the zNanog HD, five N-terminal and 16 C-terminal amino acids. Error bars indicate 1 s.d. (B) Phase and GFP images of emerging Nanog-/- iPS cell colonies during 2i/LIF induction of Nanog-/- pre-iPS cells transfected with zNanog HD. (C) AP staining of Nanog-/- iPS cell colonies 10 days after 2i/LIF medium switch. (D) Quantification of the total number of AP-positive iPS cell colonies at day 10 after medium switch. Error bars indicate 1 s.d. (n=2). (E) Phase and GFP images of established Nanog-/- iPS cells generated with the zNanog HD. (F) RT-PCR analysis confirming the presence of transcripts corresponding to zNanog HD, but not full-length zNanog, in HD-only iPS-/- cells. (G) qRT-PCR analysis for expression of full-length mNanog, Rex1, endogenous (endo.) Oct4, retroviral (r) Oct4, rKlf4 and rMyc in mNanog iPS-/- cells and zNanog HD-only iPS-/- cells. Error bars indicate 1 s.d. (H) RNA FISH for the Xist transcript showing the presence of an Xist RNA pinpoint signal in HD-only iPS-/- cells. (I) Chimeric mice obtained after blastocyst injection of zNanog HD-only iPS-/- cells following Cre excision of the HD transgene. Fluorescence and agouti coat colour indicate contribution from iPS-/- cells generated with HD-only iPS-/- cells. |