
Fig. 2
- ID
- ZDB-FIG-120330-16
- Publication
- Theunissen et al., 2011 - Reprogramming capacity of Nanog is functionally conserved in vertebrates and resides in a unique homeodomain
- Other Figures
- All Figure Page
- Back to All Figure Page
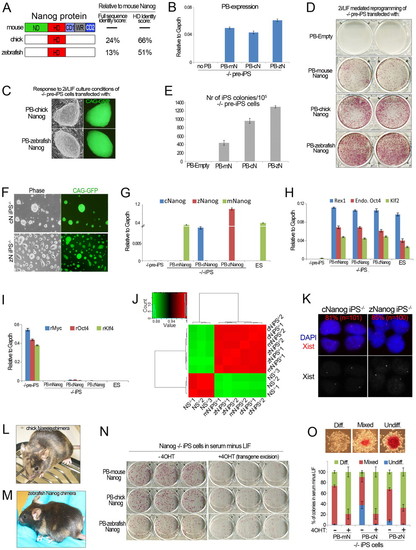
Vertebrate Nanog orthologs induce naive pluripotency. (A) Structural alignment of mNanog with non-mammalian Nanog ortholog proteins. Identity scores between full-length proteins or homeodomain (HD) only are indicated on the right. The identity scores were calculated using ClustalW2. ND, N-terminal domain; CD1, C-terminal domain 1; WR, tryptophan repeat; CD2, C-terminal domain 2. (B) qRT-PCR analysis for expression of the piggyBac (PB) sequence in Nanog–/– pre-iPS cells transfected with mouse (m), chick (c) or zebrafish (z) Nanog (N) PB. Data are relative levels. Error bars indicate 1 s.d. (C) Phase contrast and GFP images of emerging Nanog–/– iPS cell colonies. (D) Alkaline phosphatase (AP) staining of emerging Nanog–/– iPS cell colonies. (E) Quantification of the total number of AP-positive iPS cell colonies. Data are mean values. Error bars indicate 1 s.d. (n=2). (F) Phase contrast and GFP images of Nanog–/– iPS cells generated with cNanog or zNanog. (G) qRT-PCR analysis confirming the presence of cNanog or zNanog transcript in cNanog iPS–/– cells and zNanog iPS–/– cells, respectively. This panel only serves to verify the expression of the intended ortholog. Relative expression levels from different Taqman assays cannot be cross-compared. Quantification of total PB transgene expression in these samples is provided in Fig. 3H. Data are relative levels. Error bars indicate 1 s.d. (H,I) qRT-PCR analysis for pluripotent gene (H) and retroviral (r) transgene (I) expression in Nanog–/– pre-iPS cells, mNanog, cNanog and zNanog iPS–/– cells, and ES cells. Data are relative levels. Error bars indicate 1 s.d. (J) Correlation heatmap of global gene expression between Nanog–/– NS cells, mNanog (mN) iPS–/– cells, cNanog (cN) iPS–/– cells and zNanog (zN) iPS–/– cells. Two biological replicates were included for each cell line. (K) RNA FISH for Xist in Nanog–/– iPS cells. (L,M) Adult chimeric mouse obtained after blastocyst injection of either cNanog iPS–/– cells (L) or zNanog iPS–/– cells (M) following Cre excision of the Nanog transgene. Agouti coat color indicates chimerism. (N) AP staining of mNanog, cNanog and zNanog iPS–/– cells plated at clonal density in serum minus LIF before and after tamoxifen-induced Cre excision of the PB transgene. (O) Quantification of the proportion of undifferentiated, mixed and differentiated colonies in each condition shown in N. Error bars indicate 1 s.d. (n=3). Representative examples of colonies in each category are shown. |