
|
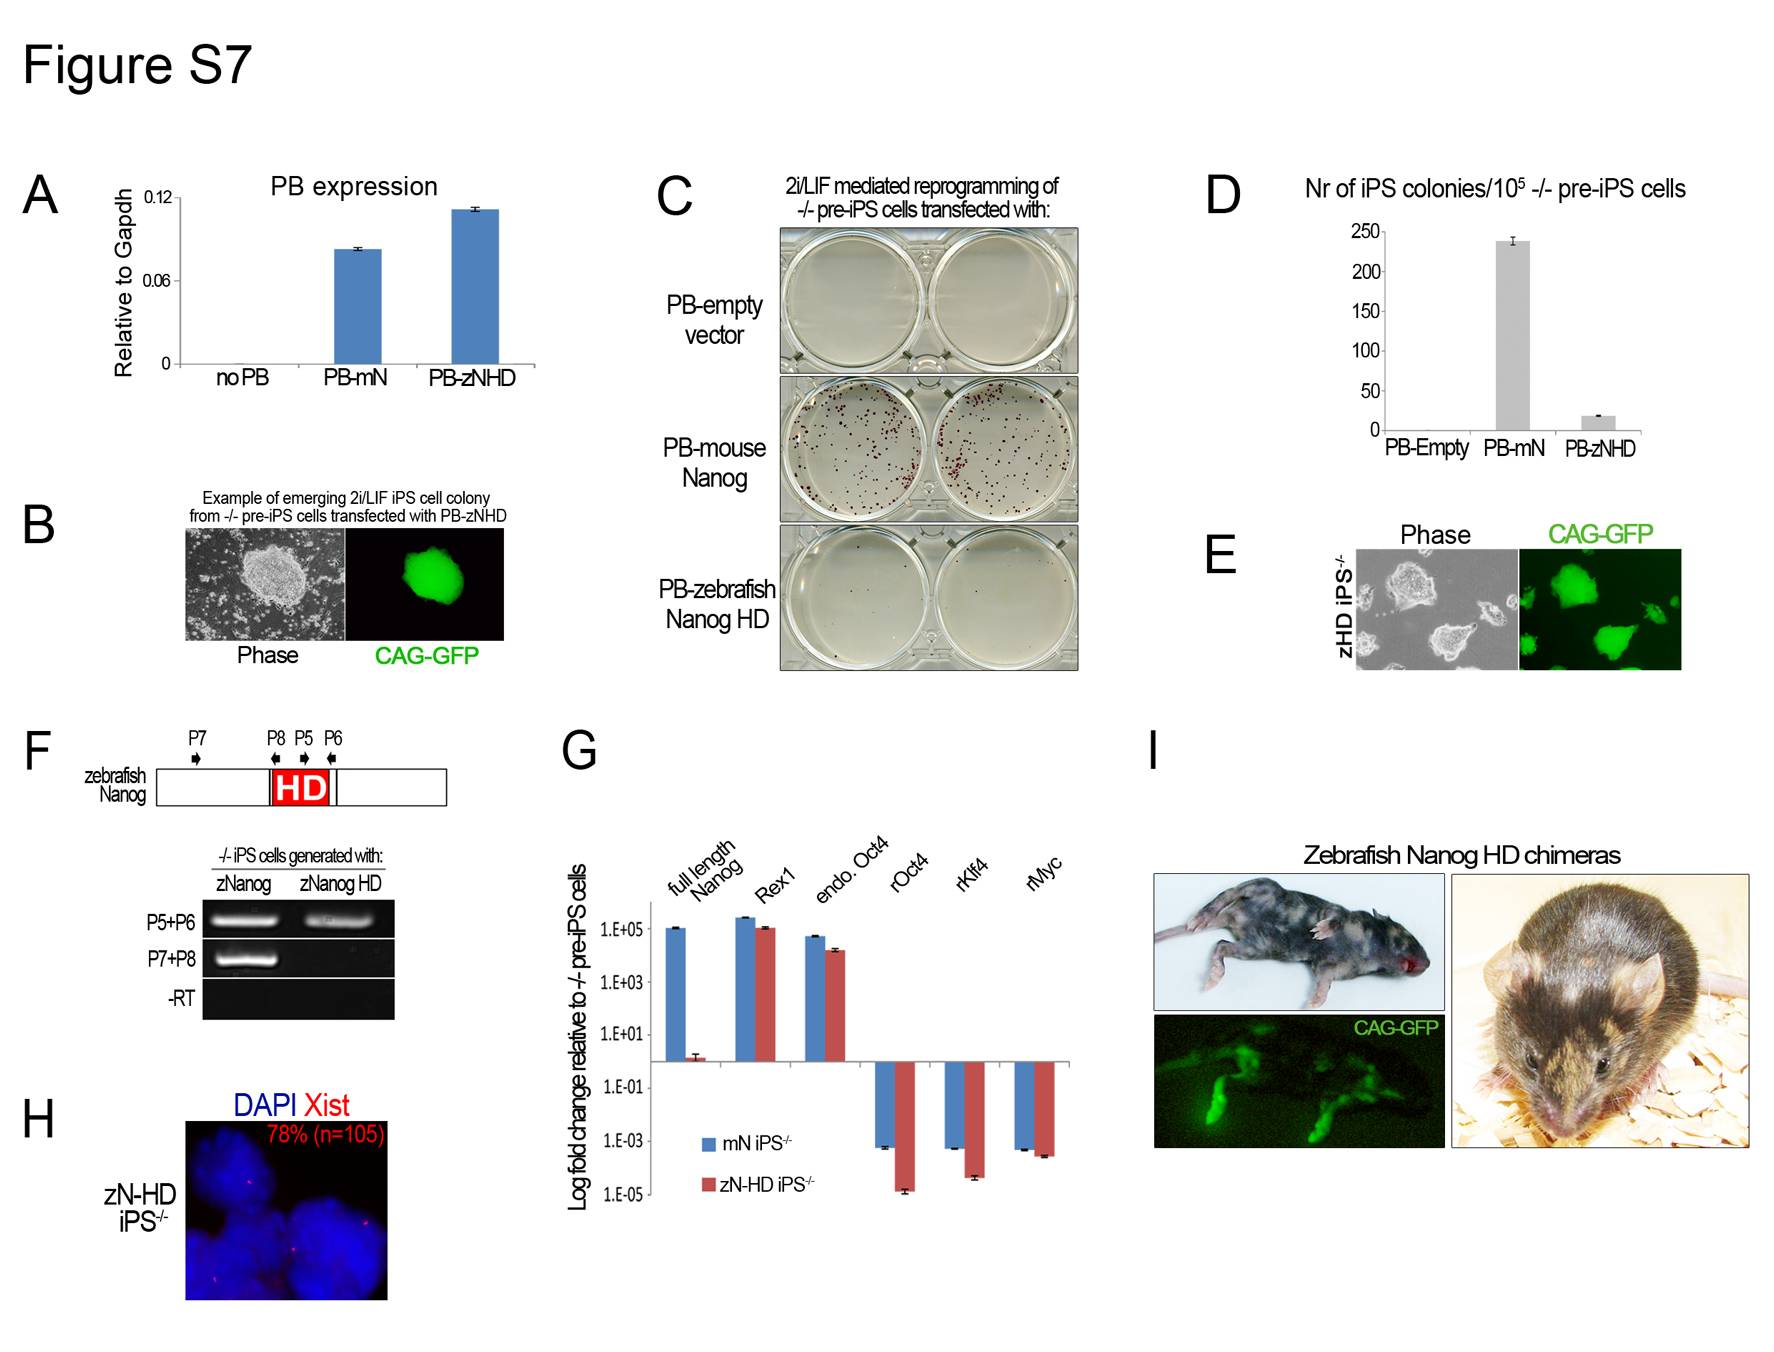
Fig. S7 A small fragment that includes the homeodomain of zebrafish Nanog induces pluripotency. (A) qRT-PCR analysis for expression of the piggyBac (PB) transgene sequence in Nanog-/- pre-iPS cells transfected with an 81 amino acid fragment that includes the zNanog HD, five N-terminal and 16 C-terminal amino acids. Error bars indicate 1 s.d. (B) Phase and GFP images of emerging Nanog-/- iPS cell colonies during 2i/LIF induction of Nanog-/- pre-iPS cells transfected with zNanog HD. (C) AP staining of Nanog-/- iPS cell colonies 10 days after 2i/LIF medium switch. (D) Quantification of the total number of AP-positive iPS cell colonies at day 10 after medium switch. Error bars indicate 1 s.d. (n=2). (E) Phase and GFP images of established Nanog-/- iPS cells generated with the zNanog HD. (F) RT-PCR analysis confirming the presence of transcripts corresponding to zNanog HD, but not full-length zNanog, in HD-only iPS-/- cells. (G) qRT-PCR analysis for expression of full-length mNanog, Rex1, endogenous (endo.) Oct4, retroviral (r) Oct4, rKlf4 and rMyc in mNanog iPS-/- cells and zNanog HD-only iPS-/- cells. Error bars indicate 1 s.d. (H) RNA FISH for the Xist transcript showing the presence of an Xist RNA pinpoint signal in HD-only iPS-/- cells. (I) Chimeric mice obtained after blastocyst injection of zNanog HD-only iPS-/- cells following Cre excision of the HD transgene. Fluorescence and agouti coat colour indicate contribution from iPS-/- cells generated with HD-only iPS-/- cells.