
- Title
-
MicroRNA let-7a suppresses breast cancer cell migration and invasion through down-regulation of C-C chemokine receptor type 7
- Authors
- Kim, S.J., Shin, J.Y., Lee, K.D., Bae, Y.K., Sung, K.W., Nam, S.J., and Chun, K.H.
- Source
- Full text @ Breast Cancer Res.
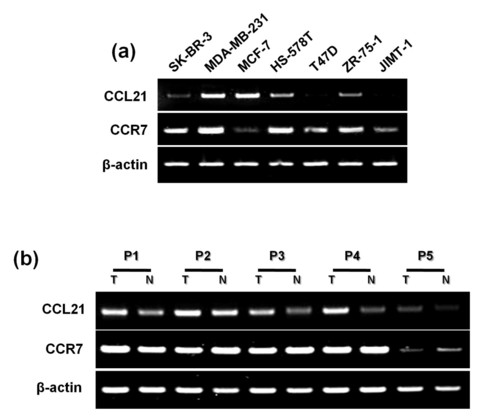
Detection of mRNA expression levels of CCR7 and CCL21. CCR7 and CCL21 mRNA expression levels were detected with RT-PCR analysis in seven breast cancer cell lines (a) and five breast cancer patient tissues (b). β-actin was used as a normalization control. |

Detection of basal expression levels of CCR7, IGF-1R, c-Myc, CDK-4, and let-7a in seven breast cancer cell lines. (a-b) Let-7a expression levels in breast cancer cells, detected with Northern blot analysis (NB)(a) and real-time RT-PCR(b). U6 and RNU6B were used as a normalization control. (c) Detection of protein expression levels of CCR7, IGF-1R, c-Myc, and CDK-4 by using Western blot analysis. β-actin was used as a normalization control. |
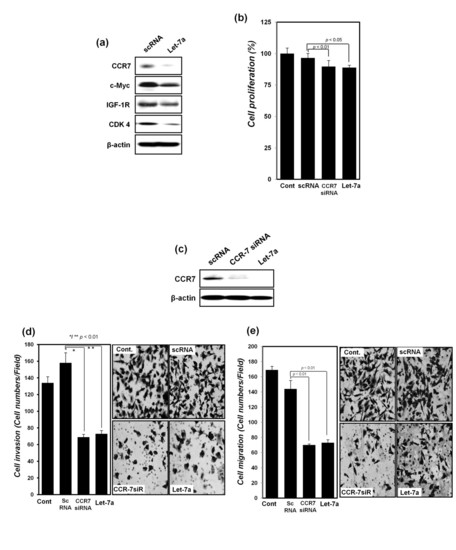
Detection of changes in the expression of let-7a predicted target proteins and cell proliferation, cell migration, and invasion of MDA-MB-231 breast cancer cells after transfection with synthetic let-7a. (a) After transfection with scRNA or synthetic let-7a, protein expression of CCR7, IGF-1R, c-Myc, and CDK-4 was detected with Western blot analysis. (b) Proliferation of MDA-MB-231 cells was assessed with MTT assay after transfection with scRNA, CCR7 siRNA, and synthetic let-7a, respectively. (c) Protein expression of CCR7 was detected with Western blot analysis after transfection with scRNA, CCR7 siRNA, and synthetic let-7a, respectively. β-actin was used as a normalization control. (d) Cell-migration assays and (e) invasion assays performed after transfection with scRNA, CCR7 siRNA, and synthetic let-7a, as described in Materials and Methods, presented as a histogram (left panel) with cell photos (right panel) All the experiments were performed in triplicate independently. |
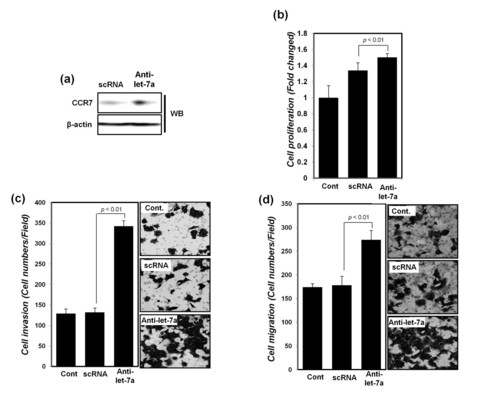
Cell proliferation, cell migration, and invasion of MCF-7 breast cancer cell lines were increased after transfection with anti-let7a. (a) Protein expression of CCR7 was detected with Western blot analysis after transfection with scRNA and anti-let-7a, respectively. β-actin was used as a normalization control. After transfection with scRNA or anti-let7a, (b) cell proliferation by MTT analysis, (c) cell-migration assays, and (d) invasion assays were performed, as described in Material and Methods, and the results of (c) and (d) presented as a histogram (left panel) with cell photos (right panel). All experiments were performed in triplicate independently. |
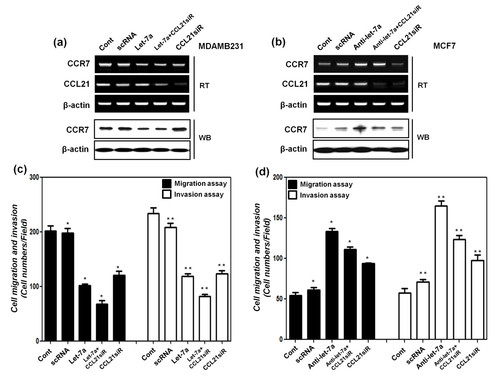
Let-7a regulates cell migration and invasion of MDA-MB-231 and MCF-7 cell lines, dependent on CCR-7-CCL21 signaling. (a) mRNA expression of CCL21 and CCR7, and protein expression of CCR7 were detected with RT-PCR and Western blot analysis after transfection with scRNA, synthetic let-7a, and CCL21 siRNA in MDA-MB-231 cells, respectively. β-actin was used as a normalization control. (b) mRNA expression of CCL21 and CCR7, and protein expression of CCR7 were detected with RT-PCR and Western blot analysis after transfection with scRNA, anti-let-7a, and CCL21 siRNA in MCF-7 cells, respectively. β-actin was used as a normalization control. (c) After transfection with scRNA, synthetic let-7a, and CCL21 siRNA into MDA-MB-231cells, cell-migration assays and cell-invasion assays were performed (*, **P < 0.01 versus control group). (d) After transfection with scRNA, synthetic anti-let-7a, and CCL21 siRNA into McF-7 cells, cell-migration assays and cell-invasion assays were performed (*, **P < 0.01 versus control group). The assays were described in Material and Methods, and the results of (c) and (d) are presented as a histogram. All experiments were performed in triplicate independently. |
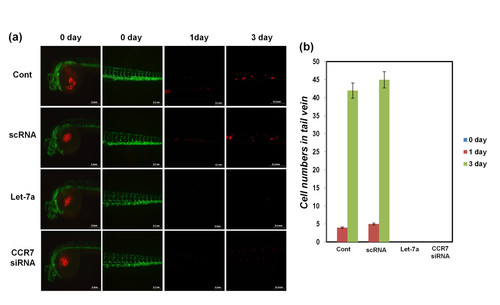
Detection of the migration of breast cancer cells in zebrafish embryos as an in vivo animal model. (a, b) RFP-labeled MDA-MB-231 cells were transfected with synthetic let-7a, CCR7 siRNA, and scRNA, respectively, and injected into the center of the yolk sac of transgenic zebrafish in which embryonic vessels are visualized with green fluorescence, as described in the Material and Methods section. After 1 day and 3 days of injections, RFP-labeled MDA-MB-231 cells were detected in GFP-labeled vessels by using a fluorescence microscope, and the results are presented as a photograph in (a). The number of migrating cells was counted (b). The data were derived from three replicated experiments. The scale bars are 200 μm and 50 μm in the last panels. |