
- Title
-
Growth Hormone Promotes Hair Cell Regeneration in the Zebrafish (Danio rerio) Inner Ear following Acoustic Trauma
- Authors
- Sun, H., Lin, C.H., and Smith, M.E.
- Source
- Full text @ PLoS One

Effect of GH on hair cell bundle density. (A) Phalloidin-labeled saccular epithelia of baseline, buffer-injected, and GH-injected zebrafish at post-sound exposure day 2 (psed2). The upper image shows the five locations of hair cell counts along the rostral-caudal axis of the saccule. The enlarged images to the right of the saccules are representative 100X images of saccules at 75% along the rostral-caudal axis. Scale bar = 100 μm, D = dorsal, R = rostral, * = presumed newly formed hair cell bundles, ∧ = scar formation characteristic of hair cell loss. (B) Mean (±S.E.) number of hair cell bundles/900 μm2 at specified locations along the rostral-caudal axis of the saccule of baseline and buffer- or GH-injected zebrafish. N = 6; * P<0.001. |

Effect of GH on hair cell type. Phalloidin-labeled saccular epithelia of (A) baseline, (B) buffer-injected, and (C) GH-injected zebrafish at post-sound exposure day 2 (psed2) at 25% along the rostral-caudal axis of the saccule. Arrow = hair cell with missing and splayed stereocilia; triangle = bundleless hair cell, * = presumed newly formed hair bundles. Mean (±S.E.) number of hair cell bundles/900 μm2 at (D) 25% and (E) 75% along the rostral-caudal axis of the saccule of buffer- or GH-injected zebrafish. A similar pattern was evident at the 50% rostral-caudal location. N = 6; * P<0.001. |

Effect of GH on cell proliferation. (A) 100X images of BrdU and DAPI labeling in the saccules of buffer- and GH-injected zebrafish. (B) Mean (±S.E.) number of BrdU-labeled cells in the saccules, lagenae, and utricles of baseline and buffer- or GH-injected zebrafish. N = 6; * P<0.001. (C) BrdU-labeling in the saccules of baseline, buffer- or GH-injected zebrafish at post-sound exposure day 1 (psed1). Scale bar = 100 μm. Rostral-caudal orientation is the same as Fig. 1A. |
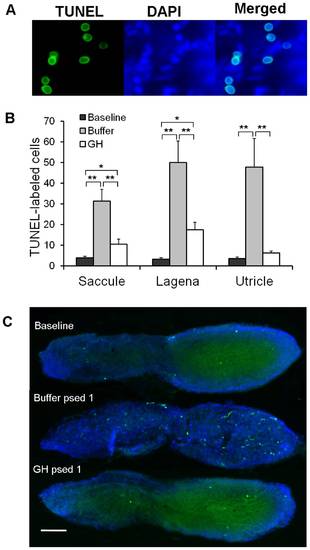
Effect of GH on apoptosis. (A) 100X images of TUNEL and DAPI labeling in the saccule of a buffer-injected zebrafish. (B) Mean (±S.E.) number of TUNEL-labeled cells in the saccules, lagenae, and utricles of baseline and buffer- or GH-injected zebrafish. N = 6; * P<0.01, ** P<0.001. (C) TUNEL-labeling in the saccules of baseline, buffer- or GH-injected zebrafish at post-sound exposure day 1 (psed1). Scale bar = 100 μm. Rostral-caudal orientation is the same as Fig. 1A. |
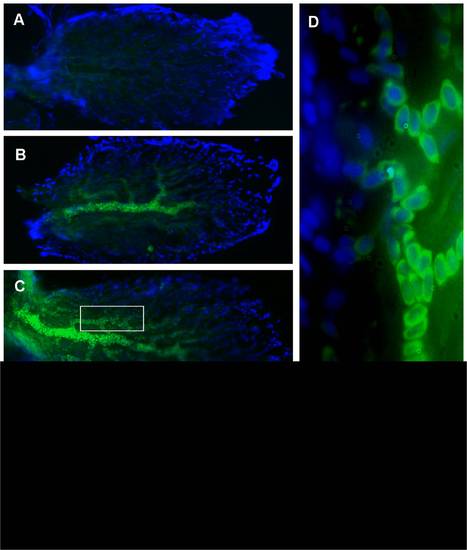
Expression of GH mRNA in zebrafish saccules. Photomicrographs of saccules of zebrafish labeled with probes against GH mRNA via fluorescent in situ hybridization (FISH); green = FITC conjugated probe, blue = DAPI. Saccules from (A) a baseline control (not exposed to sound) and (B–E) sound-exposed zebrafish. (D) 100X image of the boxed area in (C), showing that GH mRNA appears to be localized perinuclearly in blood cells. (A–C) show only the caudal portion, while (E) shows a whole saccule. Caudal is to the right as in previous figures. Scale bars (D = 10 μm; E = 100 μm). |

Effect of GH antagonist on cell proliferation. (A) Mean (±S.E.) number of BrdU-labeled cells in the saccules, lagenae, and utricles of buffer- or GH-antagonist-injected zebrafish. N = 6–8; * P<0.001. (B) BrdU-labeling in representative saccules of buffer- or GH-injected (two examples are provided) zebrafish at post-sound exposure day 1 (psed1). Rostral-caudal orientation is the same as Fig. 1A. |