
- Title
-
Zebrafish Thsd7a is a neural protein required for angiogenic patterning during development
- Authors
- Wang, C.H., Chen, I.H., Kuo, M.W., Su, P.T., Lai, Z.Y., Wang, C.H., Huang, W.C., Hoffman, J., Kuo, C.J., You, M.S., and Chuang, Y.J.
- Source
- Full text @ Dev. Dyn.
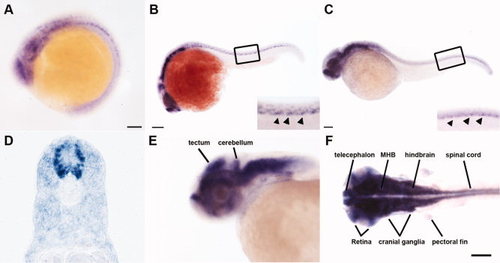
thsd7a transcripts were detected in the zebrafish developing nervous system. Representative embryos show the spatiotemporal expression pattern of thsd7a transcripts by in situ hybridization. Anterior is to the left. A: thsd7a expression was first detected at 15 hours postfertilization (hpf). B: At 22 hours postfertilization (hpf). The inset image is an enlarged view of the boxed region. The unique thsd7a expression pattern along the ventral edge of neural tube is indicated by arrowheads. C: At 32 hpf. Expression of thsd7a along the ventral edge of neural tube is indicated by arrowheads in the inset image enlarged from boxed region. D: Cross-section through the trunk region at 32 hpf. E,F: At 48 hpf, thsd7a is expressed in the midbrain, hindbrain, midbrain–hindbrain boundary (MHB), cerebellum, telencephalon, tectum, retina, cranial ganglia, spinal cord, and pectoral fin. F: Dorsal view. Scale bars = 20 μm in A; 50 μm in B; 100 μm in C,F. EXPRESSION / LABELING:
|

Morpholino (MO) knockdown of Thsd7a in zebrafish embryos. A: The genomic structure of thsd7a showing the effect of MO1 injection on mRNA splicing. Relative positions of primers used for reverse transcription polymerase chain reaction (RT-PCR) are shown. B: MO1 injection disrupted the accurate mRNA splicing. RT-PCR products using the F1/R1-1 primer pair reveal the level of accurate mRNA splicing. Products using the F1/R1-2 primer pair show the level of mRNA containing the retained intron. Beta-actin (bactin) was amplified as an internal control. A total of 2 ng of MO1/ msMO1 were injected. C: Real-time quantification PCR (RTq-PCR) was performed to quantify the efficacy of thsd7a MO1 knockdown in zebrafish embryos. Relative expression levels of thsd7a transcript in msMO1- and MO1-injected embryos were plotted as mean ± SEM. The 2 ng of MO1/ msMO1 were injected. D: MO2 targets the splice junction of the twelfth exon. Relative positions of primers used for RT-PCR are shown. E: Amplification product using cDNA derived from msMO2 embryos showed the expected 977 base pair fragment. MO2 injection resulted in a shorter PCR product of 712 base pairs. The 18 ng of MO2/ msMO2 were injected. |
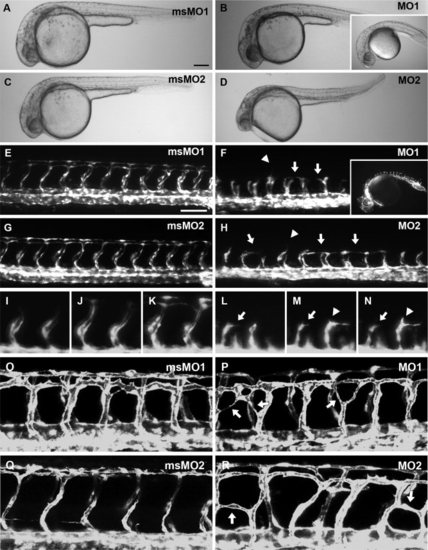
Knockdown of Thsd7a impairs intersegmental vessel (ISV) angiogenesis. Representative images showed the effect of Thsd7a knockdown on ISV angiogenesis. Anterior is to the left. Embryos were examined at 29–31 hours postfertilization (hpf; A–N), 24–36 hpf (I–N), and 50 hpf (O–R). A,C,E,G: Embryos injected with msMOs. B,D,F,H: Embryos injected with 1 ng of MO1 (B,F; the inset images in panels B and F show a representative embryo injected with 2 ng of MO1) and 9 ng of MO2 (D,H). E,G: Complete ISV networks were formed in embryos injected with msMO1 (E) or msMO2 (G). F,H: Aberrant ISV patterning was observed in embryos injected with MO1 (F) or MO2 (H). Lateral deviation is indicated by white arrows. ISVs that reached the roof of the neural tube are indicated by white arrowheads. I–N: ISV patterning in embryos injected with 1 ng of msMO1 (I–K) or 1 ng of MO1 (L–N) at 24 hpf (I,L), 30 hpf (J,M), and 36 hpf (K,N). White arrows in panels L–N indicate the EC that extended and retracted filopodia. Arrowheads in panels M and N indicate a lamellipodia-like structural extension. O–R: Representative images of ISV network in the control siblings (O, Q; 1 ng of msMO1 and 18 ng of msMO2) and the morphants (P, R; 1 ng of MO1 and 18 ng of MO2) at 50 hpf. Abnormal ISV branches are indicated by white arrows. Scale bars = 200 μm in A; 100 μm in E. |

thsd7a expression is associated with ISV development. A–F: Expression of thsd7a transcript (green) was detected by fluorescent ISH, followed by immunostaining to reveal the ISV pattern (red). Anterior is to the left. Expression of thsd7a in the ventral edge of neural tube is indicated by white arrows. Lateral deviation is indicated by white arrowheads. Scale bars represent 50 μm. Representative images showing the control embryo (A–C), and morphant at 30 hours postfertilization (hpf; D–F). G–L: Transplanted wild-type cells rescue the ISV phenotype. Embryos were examined at 28 hpf (G–I) and 50 hpf (J–L). ISVs were shown in green (G,J). Clusters of dextran-labeled cells were shown in red (H,K). G: ISVs that reached the dorsal region of the embryo were indicated by asterisk. H: Clusters of dextran-labeled cells were found in the recipients. I: Merged image of panel G and H. J,K: By 50 hpf, arrowheads indicate the normal ISVs that fused adjacently at the dorsal region of the embryo. Dextran-labeled cells were found associated with the normal ISVs. L: Images were merged. M,N: Models for the role of Thsd7a in EC migration during ISV angiogenesis. M: Thsd7a may be a membrane-anchored protein on the surface of neural cells, which distribute predominantly along the ventral edge of neural tube and located on the growth path of angiogenic ISVs. Interaction between Thsd7a and EC receptors directs EC migration during ISV angiogenesis. N: Fragments of Thsd7a may be released from neural cells, and form a concentration gradient that guide EC migration during ISV angiogenesis. NT, neural tube; N, notochord; DA, dorsal aorta; ISV, intersegmental vessel; S, somite. |
The thsd7a expression levels increase during embryogenesis. Real-time quantification polymerase chain reaction (RT-qPCR) was performed on zebrafish embryos at different developmental stages. The thsd7a expression level was first normalized by beta-actin expression and then by the level at stage 2.25 hours postfertilization (hpf), and was plotted as mean ± SEM. A small amount of thsd7a transcript was detected at 2.25 hpf. Zygotic thsd7a was up-regulated at 15 hpf and persistently increased during the examined developmental period. EXPRESSION / LABELING:
|
The thsd7a expression levels increase during embryogenesis. Real-time quantification polymerase chain reaction (RT-qPCR) was performed on zebrafish embryos at different developmental stages. The thsd7a expression level was first normalized by beta-actin expression and then by the level at stage 2.25 hours postfertilization (hpf), and was plotted as mean ± SEM. A small amount of thsd7a transcript was detected at 2.25 hpf. Zygotic thsd7a was up-regulated at 15 hpf and persistently increased during the examined developmental period. |

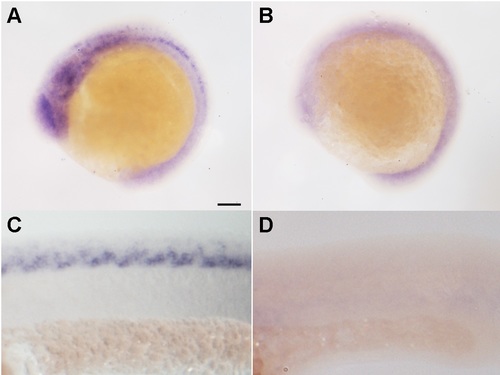
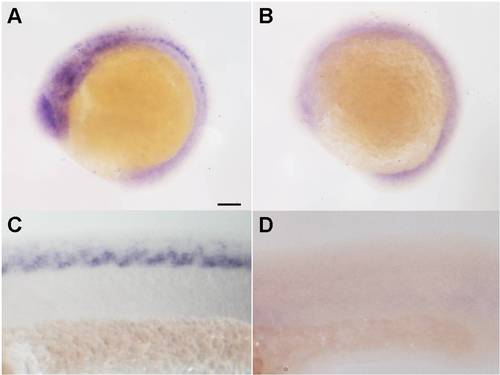
Measurement of the thsd7a in situ fluorescence signal. Integrated density of fluorescence signal in the region of neural tube was measured using the software, imageJ (NIH). Quantitative data were counted in five random fields (note: we avoided residual fluorescent particles, as indicted by white arrows in A, B) and normalized to the control. Student′s t-test was performed (with two-tailed distribution and unequal variance) in Microsoft Excel to test for differences between two sample populations. A: Representative image of thsd7a expression in the control. B: thsd7a expression in the morphant. C: Relative integrated density of thsd7a in situ fluorescence signal in the control and morphant (**P < 0.01). |

Unillustrated author statements PHENOTYPE:
|