
- Title
-
Clonal analyses reveal roles of organ founding stem cells, melanocyte stem cells and melanoblasts in establishment, growth and regeneration of the adult zebrafish fin
- Authors
- Tu, S., and Johnson, S.L.
- Source
- Full text @ Development
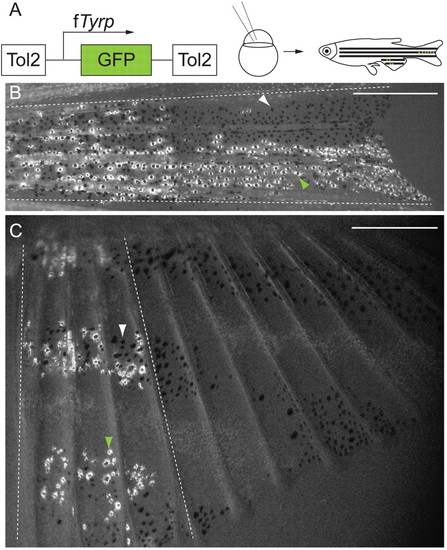
Labeled melanocyte clones extend proximo-distally in the caudal and anal fins. (A) fTyrp>GFP lineage transposon (Zou et al., 2006) was injected into one- or two-cell embryos, which were reared to maturity prior to screening for melanocyte clones in fins. (B,C) Examples of labeled melanocyte clones in center stripe, of caudal fin (B), and anterior 4 fin rays, of anal fin (C). White arrowheads indicate GFP- melanocytes; green arrowheads indicate GFP+ melanocytes; broken white lines show outer boundaries of clones. Scale bars: 0.5 mm. |

Newly formed melanocytes arise primarily at the distal edge of the fin. (A) Predictions of different models for site of melanocyte growth revealed by melanocyte time-of-differentiation assay (Hultman and Johnson, 2010). This method combines PTU treatment (to suppress melanin synthesis in newly differentiated melanocytes) with the Tg(fTyrp>GFP)j900 transgenic marker to reveal newly differentiating melanocytes. Solid green stars represent newly developed melanin- GFP+ melanocytes. Green stars with black centers represent older melanin+ GFP+ melanocytes. (B) Fluorescence image of central melanocyte stripe in caudal fin of Tg(fTyrp>GFP)j900 transgenic fish following growth for 2 weeks in the presence of PTU. White arrowheads indicate the melanin- GFP+ newly differentiated melanocytes. Near the distal end, almost all melanocytes are melanin- GFP+. Scale bar: 0.2 mm. (C) Quantitative analysis showing percentage of new melanocytes in each of the proximal, center and distal regions of the growing center stripe. Error bars indicate standard deviation. |
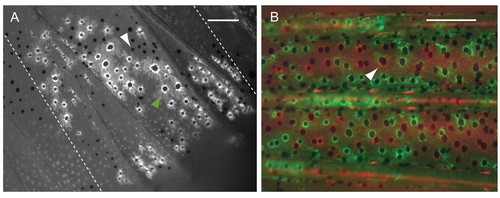
Melanocytes descended from different mFSCs intermix. (A) Fluorescence image of labeled anal fin from a mosaic animal generated by injection of fTyrp>GFP transposon. Non-labeled melanocytes (white arrowhead) are present within the territory of the GFP+ melanocytes (green arrowhead). Broken lines show the border of the clone. (B) Fluorescence image of central stripe from a fish co-injected with fTyrp>GFP and fTyrp>mCherry transposons. All melanocytes in this area are labeled either with GFP (green) or mCherry (red). Arrowhead indicates what appears to be a melanocyte of both colors, but in fact is two overlapping red and green melanocytes at different focal depth in the fin. Scale bars: 0.2 mm. |
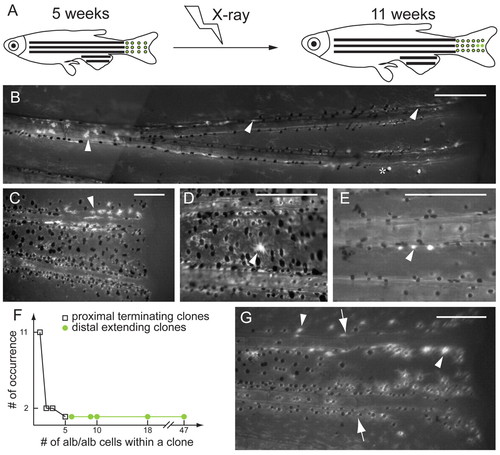
X-ray induction of albino clones in mature stage of albino/+; Tg(fTyrp>GFP)j900 fish reveals growth potential of MSCs and melanoblasts. (A) At 5 weeks, fish are exposed to 920 Rads of X-rays to induce loss-of-heterozygosity at the albino locus. albino melanocytes are revealed by expression from the fTyrp>GFP transgene upon examination 6 weeks later. (B,C) Fluorescence images of two examples of clone class that extends distally. Clones of albino cells begin in the interior of the fin and extend distally to the edge of the fin. Asterisk denotes the white cells, which reflect incident light, rather than fluorescence. (D,E) Fluorescence images of two examples of clone class located in proximal position without extending to distal edge of fin. (F) Graph shows occurrence number of clones versus the number of albino melanocytes for each clone class. (G) Regeneration of fin carrying a distal-extending clone. (B-E,G) Arrowheads indicate albino melanocytes, and (G) arrows indicate the amputation plane. Scale bars: 0.2 mm. |

Ontogenetic melanocytes and regeneration melanocytes develop from the same mFSCs. (A) Experimental procedure: kit-ts embryos were injected with the fTyrp>GFP lineage marker transposon and reared to adult stages. Following identification of fin melanocyte clones, fins were amputated and allowed to regenerate for 8 days in 25°C to reveal whether labeled clones also contribute to the regenerate. (B) Cartoon depicting the two possible relationships between ontogenetic and regeneration melanocytes. Model on the left shows predictions if ontogenetic and regeneration melanocytes develop from different mFSCs (square), model on the right shows predictions if ontogenetic and regeneration melanocytes develop from the same mFSCs. (C) Fluorescence image of labeled clone in the caudal fin center stripe before amputation. (D) Fluorescence image of the same fin at 8 dpa. White arrows indicate amputation plane. The regenerate has GFP+ melanocytes (green arrowheads) distal to the GFP+ ontogenetic melanocytes in the stump. Scale bars: 0.2 mm. |

kit-dependent and kit-independent regeneration melanocytes develop from the same mFSC. (A) kit-ts embryos were injected with the fTyrp>GFP lineage marker transposon and reared to adult stage at the permissive temperature. Following identification of fin ontogenetic and primary, kit-dependent regeneration melanocyte clones, fins were amputated again proximal to the original amputation plane and challenged to regenerate at the restrictive temperature for a further 11 days to reveal whether clones also contribute to kit-independent regeneration melanocytes. (B) How the kit-dependent and kit-independent regeneration melanocytes are related to each other: either they arise from different mFSCs (square), shown on the left; or they come from the same mFSC, shown on the right. (C,D) Fluorescence images of the same caudal fin clone regeneration (C) 8 dpa at 25°C and (D) 11 days after subsequent amputation and regeneration at 32°C. At the permissive and restrictive temperatures, GFP+ melanocytes (green arrowheads) regenerated distal to the GFP+ melanocytes in the stump. White arrows indicate amputation planes. Scale bars: 0.2 mm. |
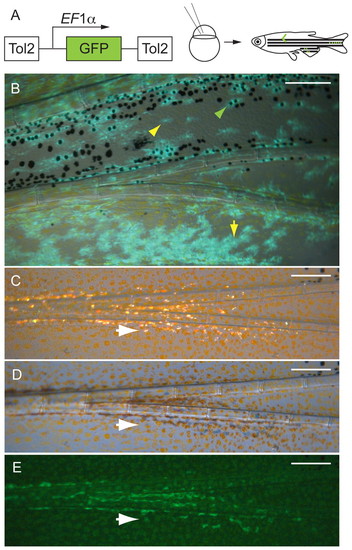
Melanocytes and xanthophores come from the same founding stem cells (mFSCs), and iridophores arise from a distinct founding stem cell (iFSC). (A) EF1α>GFP lineage marker transposon was injected into one- or two-cell stage mlpha embryos. The mosaic embryos were reared to maturity, then screened for GFP+ clones in the fins. (B) Fluorescence image of a labeled caudal fin clone in which both the melanocytes and xanthophores are labeled with GFP. Green arrowhead shows a labeled melanocyte; yellow arrowhead shows a covert xanthophore (lightly pigmented xanthophores within the melanocyte stripe) (Hirata et al., 2003; Hirata et al., 2005) and yellow arrow shows an overt xanthophore. (C-E) An iridophore clone. White arrows indicate the same iridophore in the three light conditions: (C) incident light, (D) transillumination and (E) GFP fluorescence. Scale bars: 0.2 mm. |