
- Title
-
LIMK1 and LIMK2 are important for metastatic behavior and tumor cell-induced angiogenesis of pancreatic cancer cells
- Authors
- Vlecken, D.H., and Bagowski, C.P.
- Source
- Full text @ Zebrafish
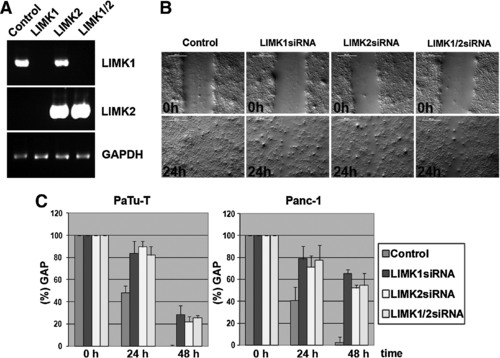
Semiquantitative RT-PCR and in vitro migration assay of pancreatic cancer cell lines. (A) Semiquantitative RT-PCR shows that LIMK1 and LIMK2 are expressed in PaTu-T, and gene-specific siRNAs for LIMK1 and LIMK2 silence the respective genes by abolishing mRNA expression. Control GAPDH expression was analyzed by RT-PCR of the same RNA samples. This loading control is shown in the lower panel. LIMK1-specific primers were used in the RT-PCR shown in the top panel and LIMK2-specific amplification is shown in the middle panel. (B) An in vitro migration assay (“scratch” assay) shows differences in migration of PaTu-T cells treated with control siRNA (Control), LIMK1 siRNA, LIMK2 siRNA, or LIMK1 plus LIMK2 siRNA (LIMK1+2). (C) Gap closure (gap width) over time is shown in percentages compared with the 0h time point (set to 100%). Error bars show standard deviations between three independent experiments. On average, on day 1 (24h) the gap closure for LIMK1 was 16.4%, LIMK2 10.3%, LIMK1/2 18%, and the control 51.8%. On day 2 (48h) the gap closure for LIMK1 was 53.6%, LIMK2 10.3%, LIMK1/2 18%, and the control 51.8%. Similar results were obtained in three independent experiments and a Student′s t-test was performed, which showed that all changes observed were significant (with p-values <0.01). PCR, polymerase chain reaction; GAPDH, glyceraldehyde 3-phosphate dehydrogenase. |
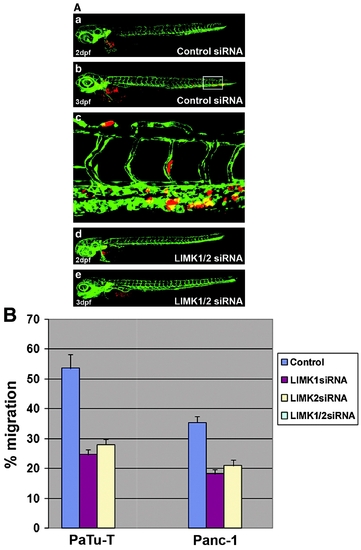
The zebrafish tumor xenograft metastasis assay. (A) Pictures taken by confocal microscopy of xenotransplanted PaTu-T cells treated with either the control siRNA (a, b) or the LIMK1/2 siRNAs (d, e). The pictures show the zebrafish directly after transplantation (2dpf) and 24h later (3dpf). In the control, cancer cells have invaded the embryo and migrated to distant sites (b). This behavior is blocked by the double knockdown (e). The area marked with a square in (b) is shown as an enlargement in (c), where cancer cells are visible in the vasculature. (B) Results of the zebrafish tumor xenograft metastasis assay performed in two different pancreatic cancer cell lines. Two independent experiments were combined for each treatment and cell type. A Student′s t-test was performed which showed that all changes observed were significant (with p-values <0.01) (data not shown). The results of all experiments are shown in Supplemental Tables. dpf, days postfertilization. (Color figure is available at www.liebertonline.com.) |
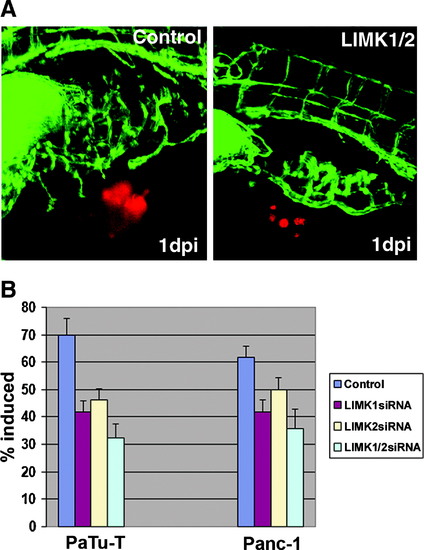
The zebrafish tumor xenograft angiogenesis assay. (A) Images taken by confocal microscopy of PaTu-T cells at 24h after cells were injected in the perivitelline space of zebrafish embryos. PaTu-T cells were treated either before implantation with the control siRNA (left image) or the LIMK1/2 siRNAs (right image). The picture on the left shows the induction of a new vessel induced by the tumor cells leading from the subintestinal vein (SIV) to the PaTu-T cell cluster. This is inhibited by the double knockdown shown in the right image. (B) Results of the zebrafish tumor xenograft angiogenesis assay performed in two different pancreatic cancer cell lines. Two independent experiments were combined for each treatment and cell type, and the number of zebrafish used for each individual treatment was 50. The results are also represented in Supplemental Tables. For statistical analysis, a Student′s t-test was performed which showed that all changes observed were significant (with p-values <0.01). (Color figure is available at www.liebertonline.com.) |