
|
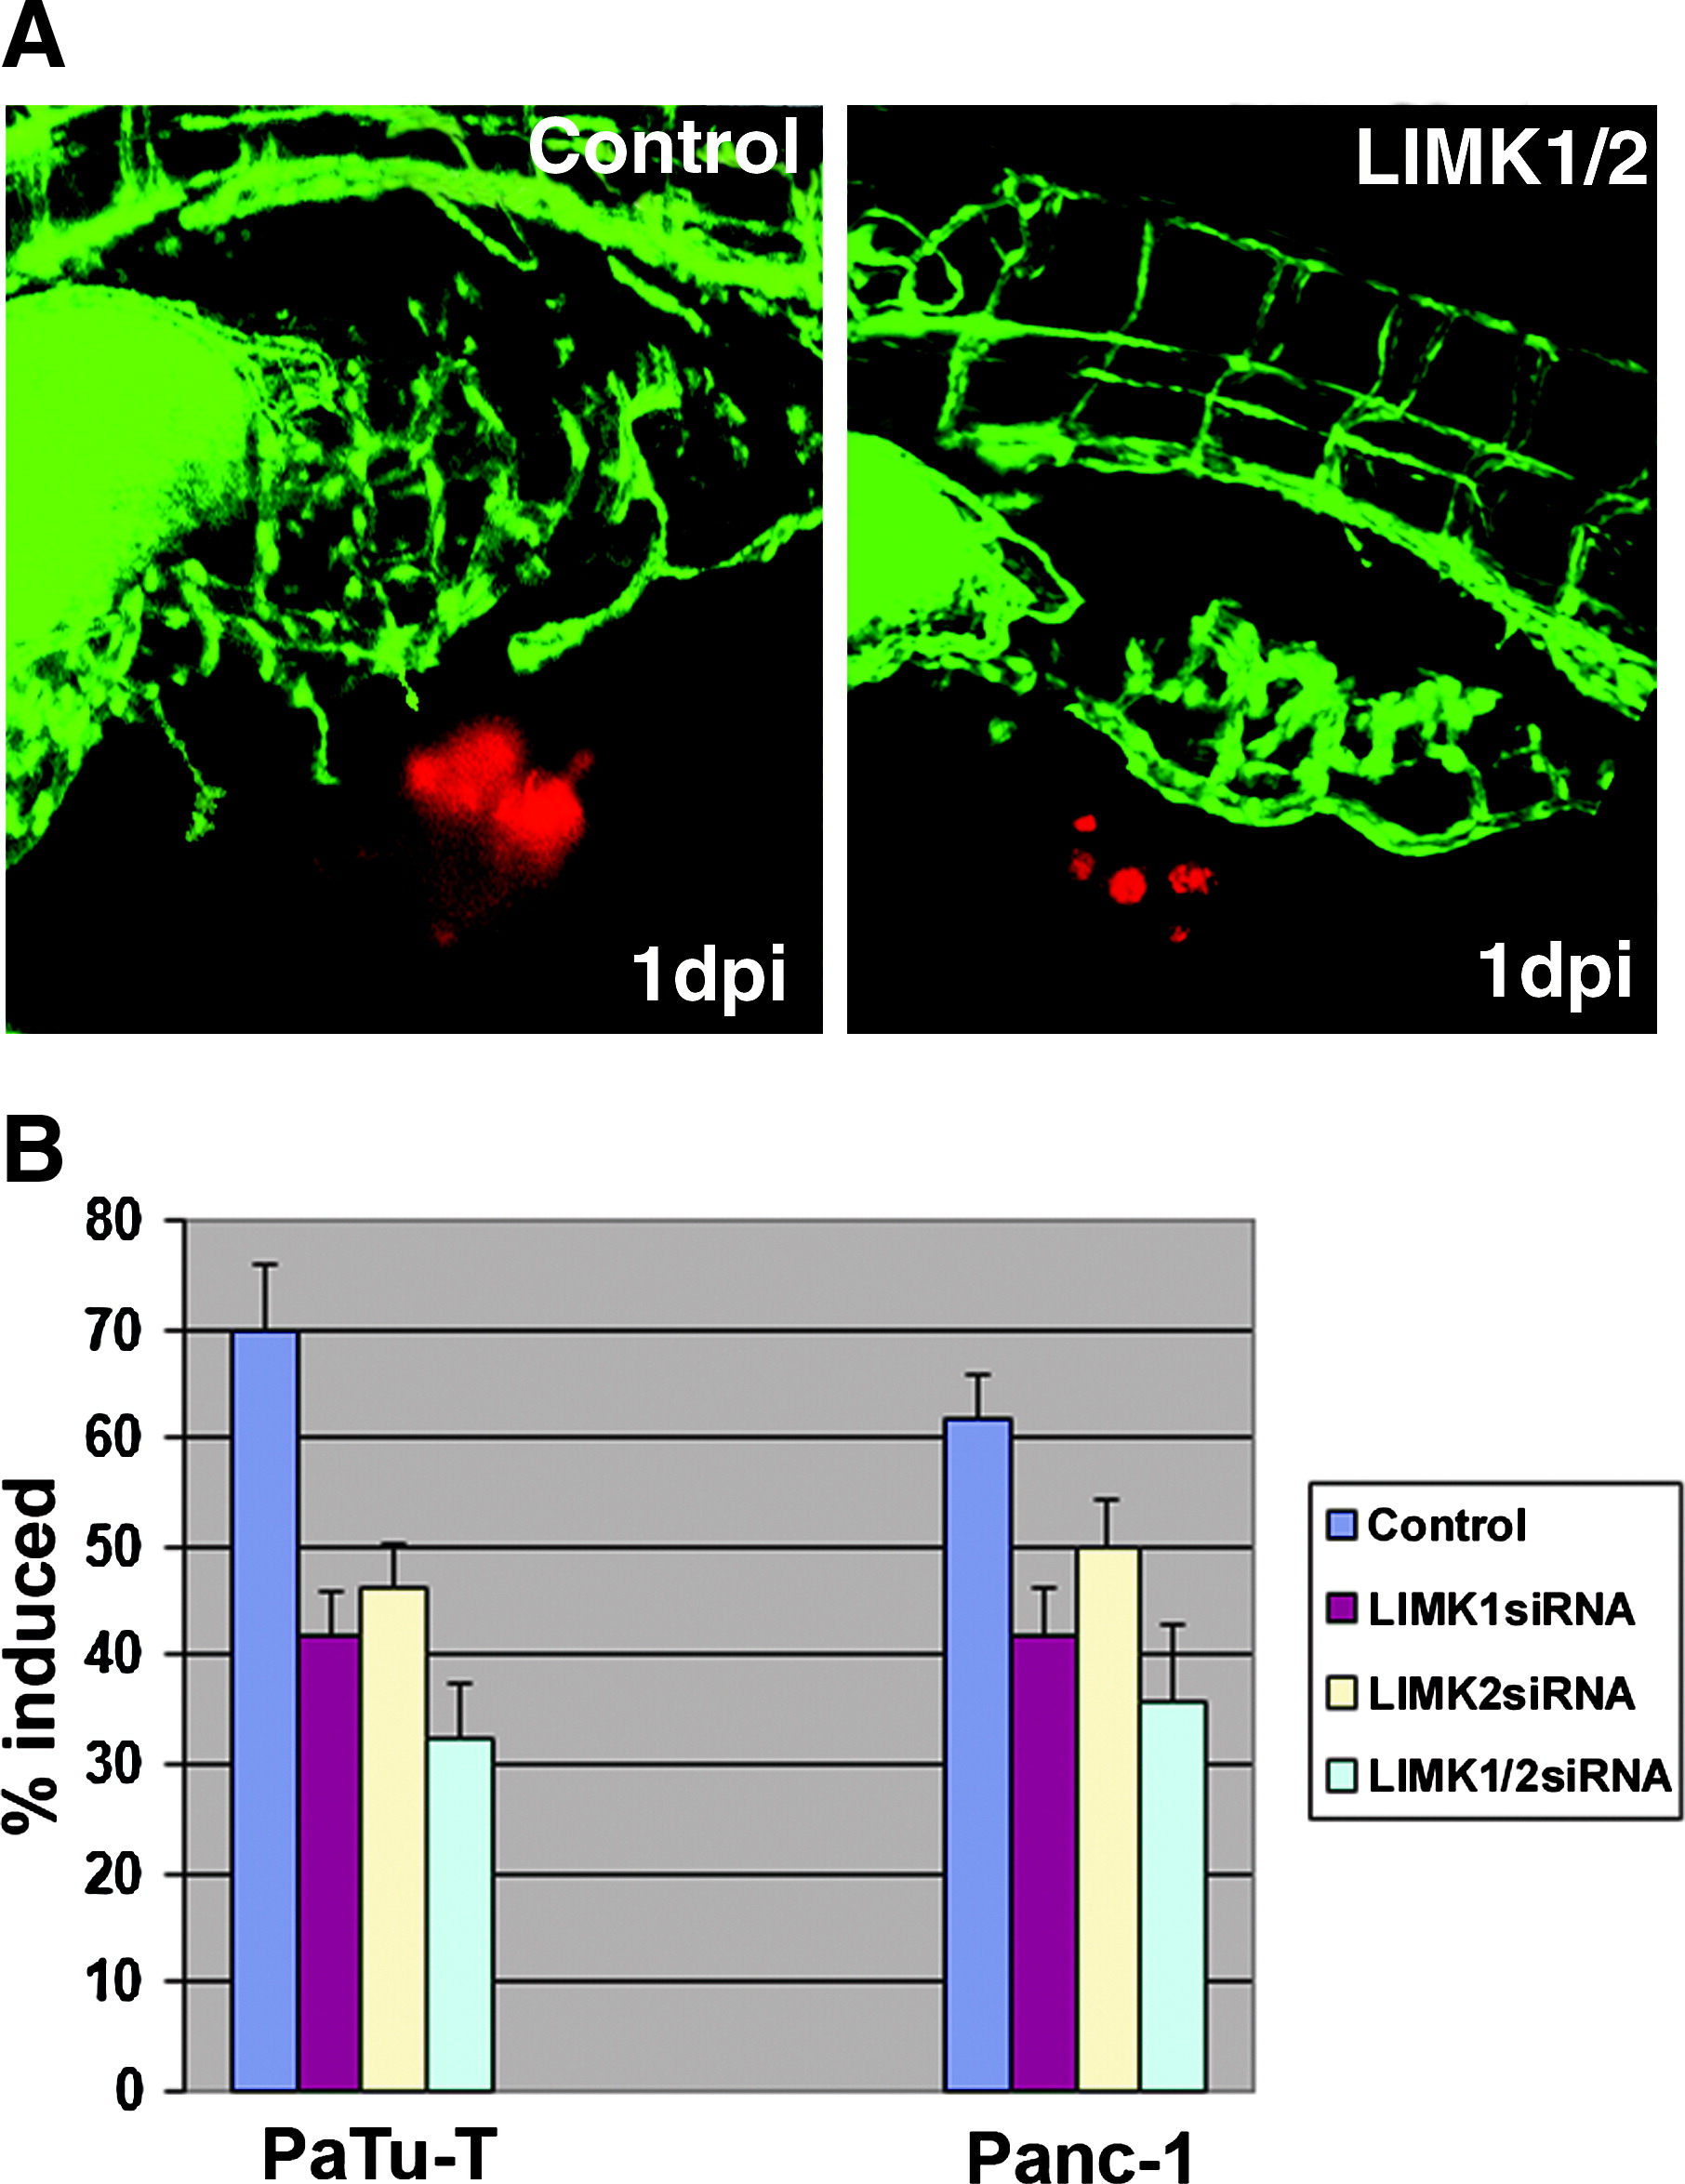
Fig. 3 The zebrafish tumor xenograft angiogenesis assay. (A) Images taken by confocal microscopy of PaTu-T cells at 24h after cells were injected in the perivitelline space of zebrafish embryos. PaTu-T cells were treated either before implantation with the control siRNA (left image) or the LIMK1/2 siRNAs (right image). The picture on the left shows the induction of a new vessel induced by the tumor cells leading from the subintestinal vein (SIV) to the PaTu-T cell cluster. This is inhibited by the double knockdown shown in the right image. (B) Results of the zebrafish tumor xenograft angiogenesis assay performed in two different pancreatic cancer cell lines. Two independent experiments were combined for each treatment and cell type, and the number of zebrafish used for each individual treatment was 50. The results are also represented in Supplemental Tables. For statistical analysis, a Student′s t-test was performed which showed that all changes observed were significant (with p-values <0.01). (Color figure is available at www.liebertonline.com.)