
|
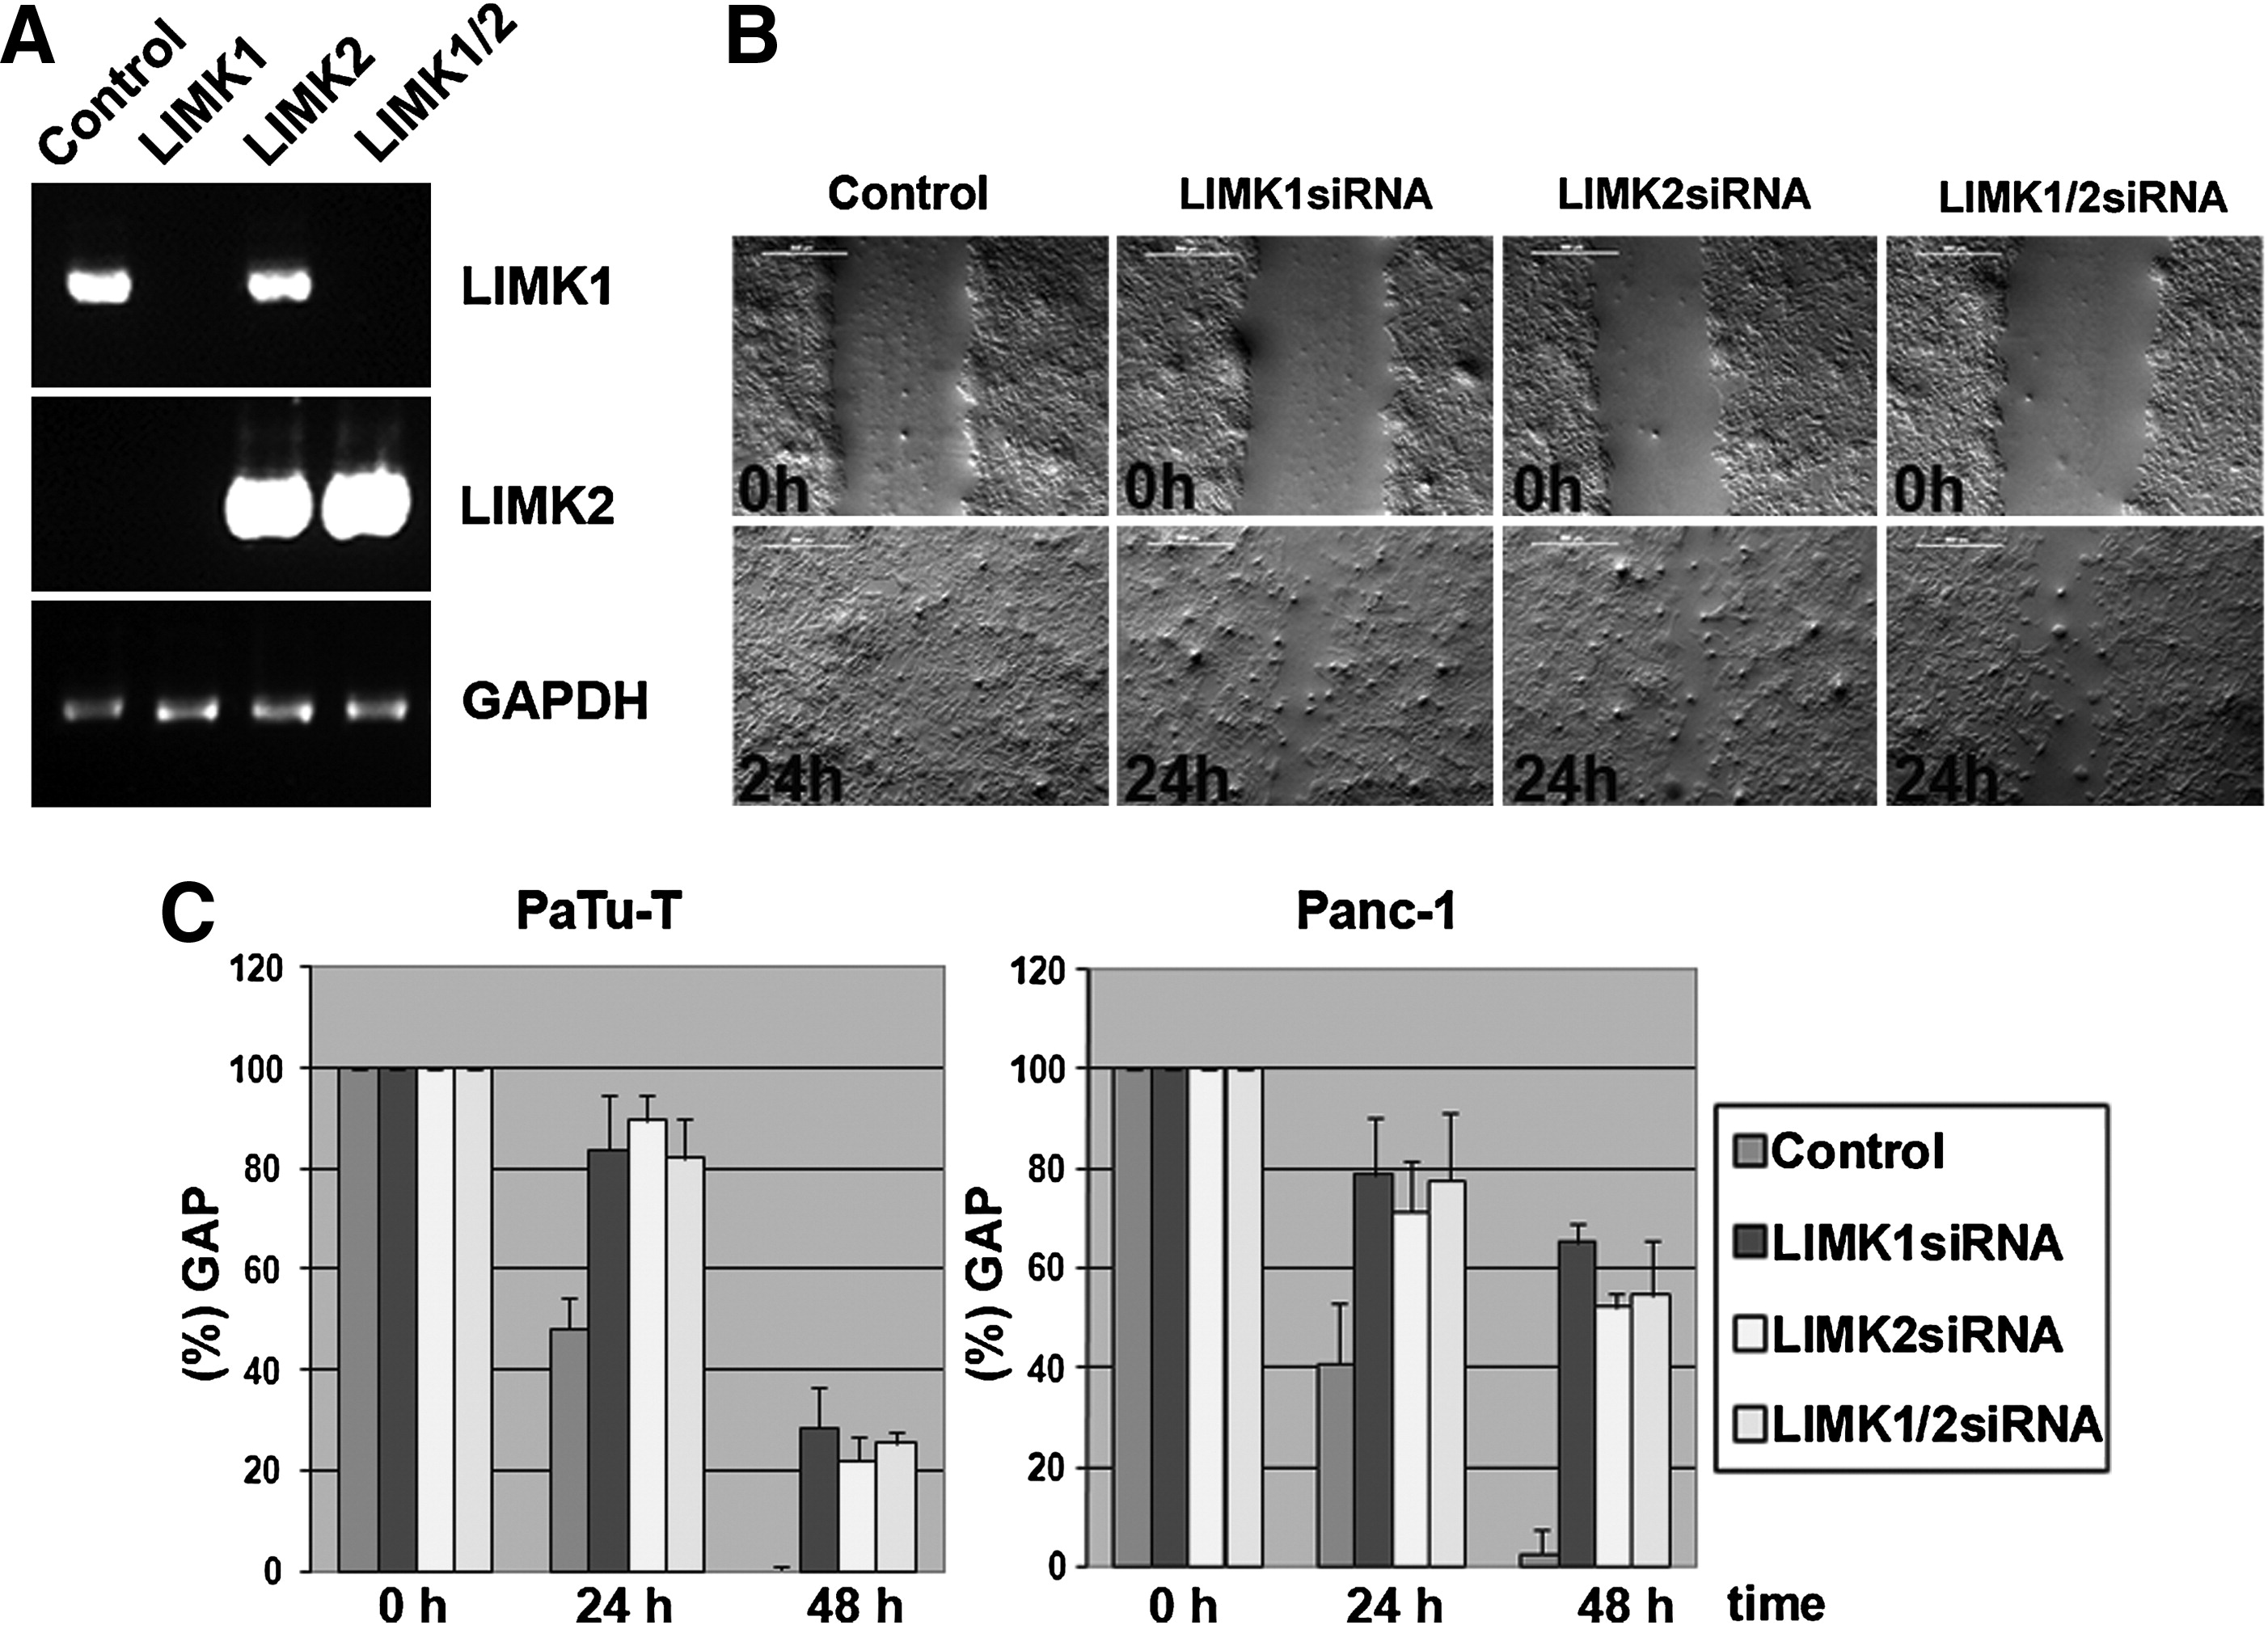
Fig. 1 Semiquantitative RT-PCR and in vitro migration assay of pancreatic cancer cell lines. (A) Semiquantitative RT-PCR shows that LIMK1 and LIMK2 are expressed in PaTu-T, and gene-specific siRNAs for LIMK1 and LIMK2 silence the respective genes by abolishing mRNA expression. Control GAPDH expression was analyzed by RT-PCR of the same RNA samples. This loading control is shown in the lower panel. LIMK1-specific primers were used in the RT-PCR shown in the top panel and LIMK2-specific amplification is shown in the middle panel. (B) An in vitro migration assay (“scratch” assay) shows differences in migration of PaTu-T cells treated with control siRNA (Control), LIMK1 siRNA, LIMK2 siRNA, or LIMK1 plus LIMK2 siRNA (LIMK1+2). (C) Gap closure (gap width) over time is shown in percentages compared with the 0h time point (set to 100%). Error bars show standard deviations between three independent experiments. On average, on day 1 (24h) the gap closure for LIMK1 was 16.4%, LIMK2 10.3%, LIMK1/2 18%, and the control 51.8%. On day 2 (48h) the gap closure for LIMK1 was 53.6%, LIMK2 10.3%, LIMK1/2 18%, and the control 51.8%. Similar results were obtained in three independent experiments and a Student′s t-test was performed, which showed that all changes observed were significant (with p-values <0.01). PCR, polymerase chain reaction; GAPDH, glyceraldehyde 3-phosphate dehydrogenase.