
|
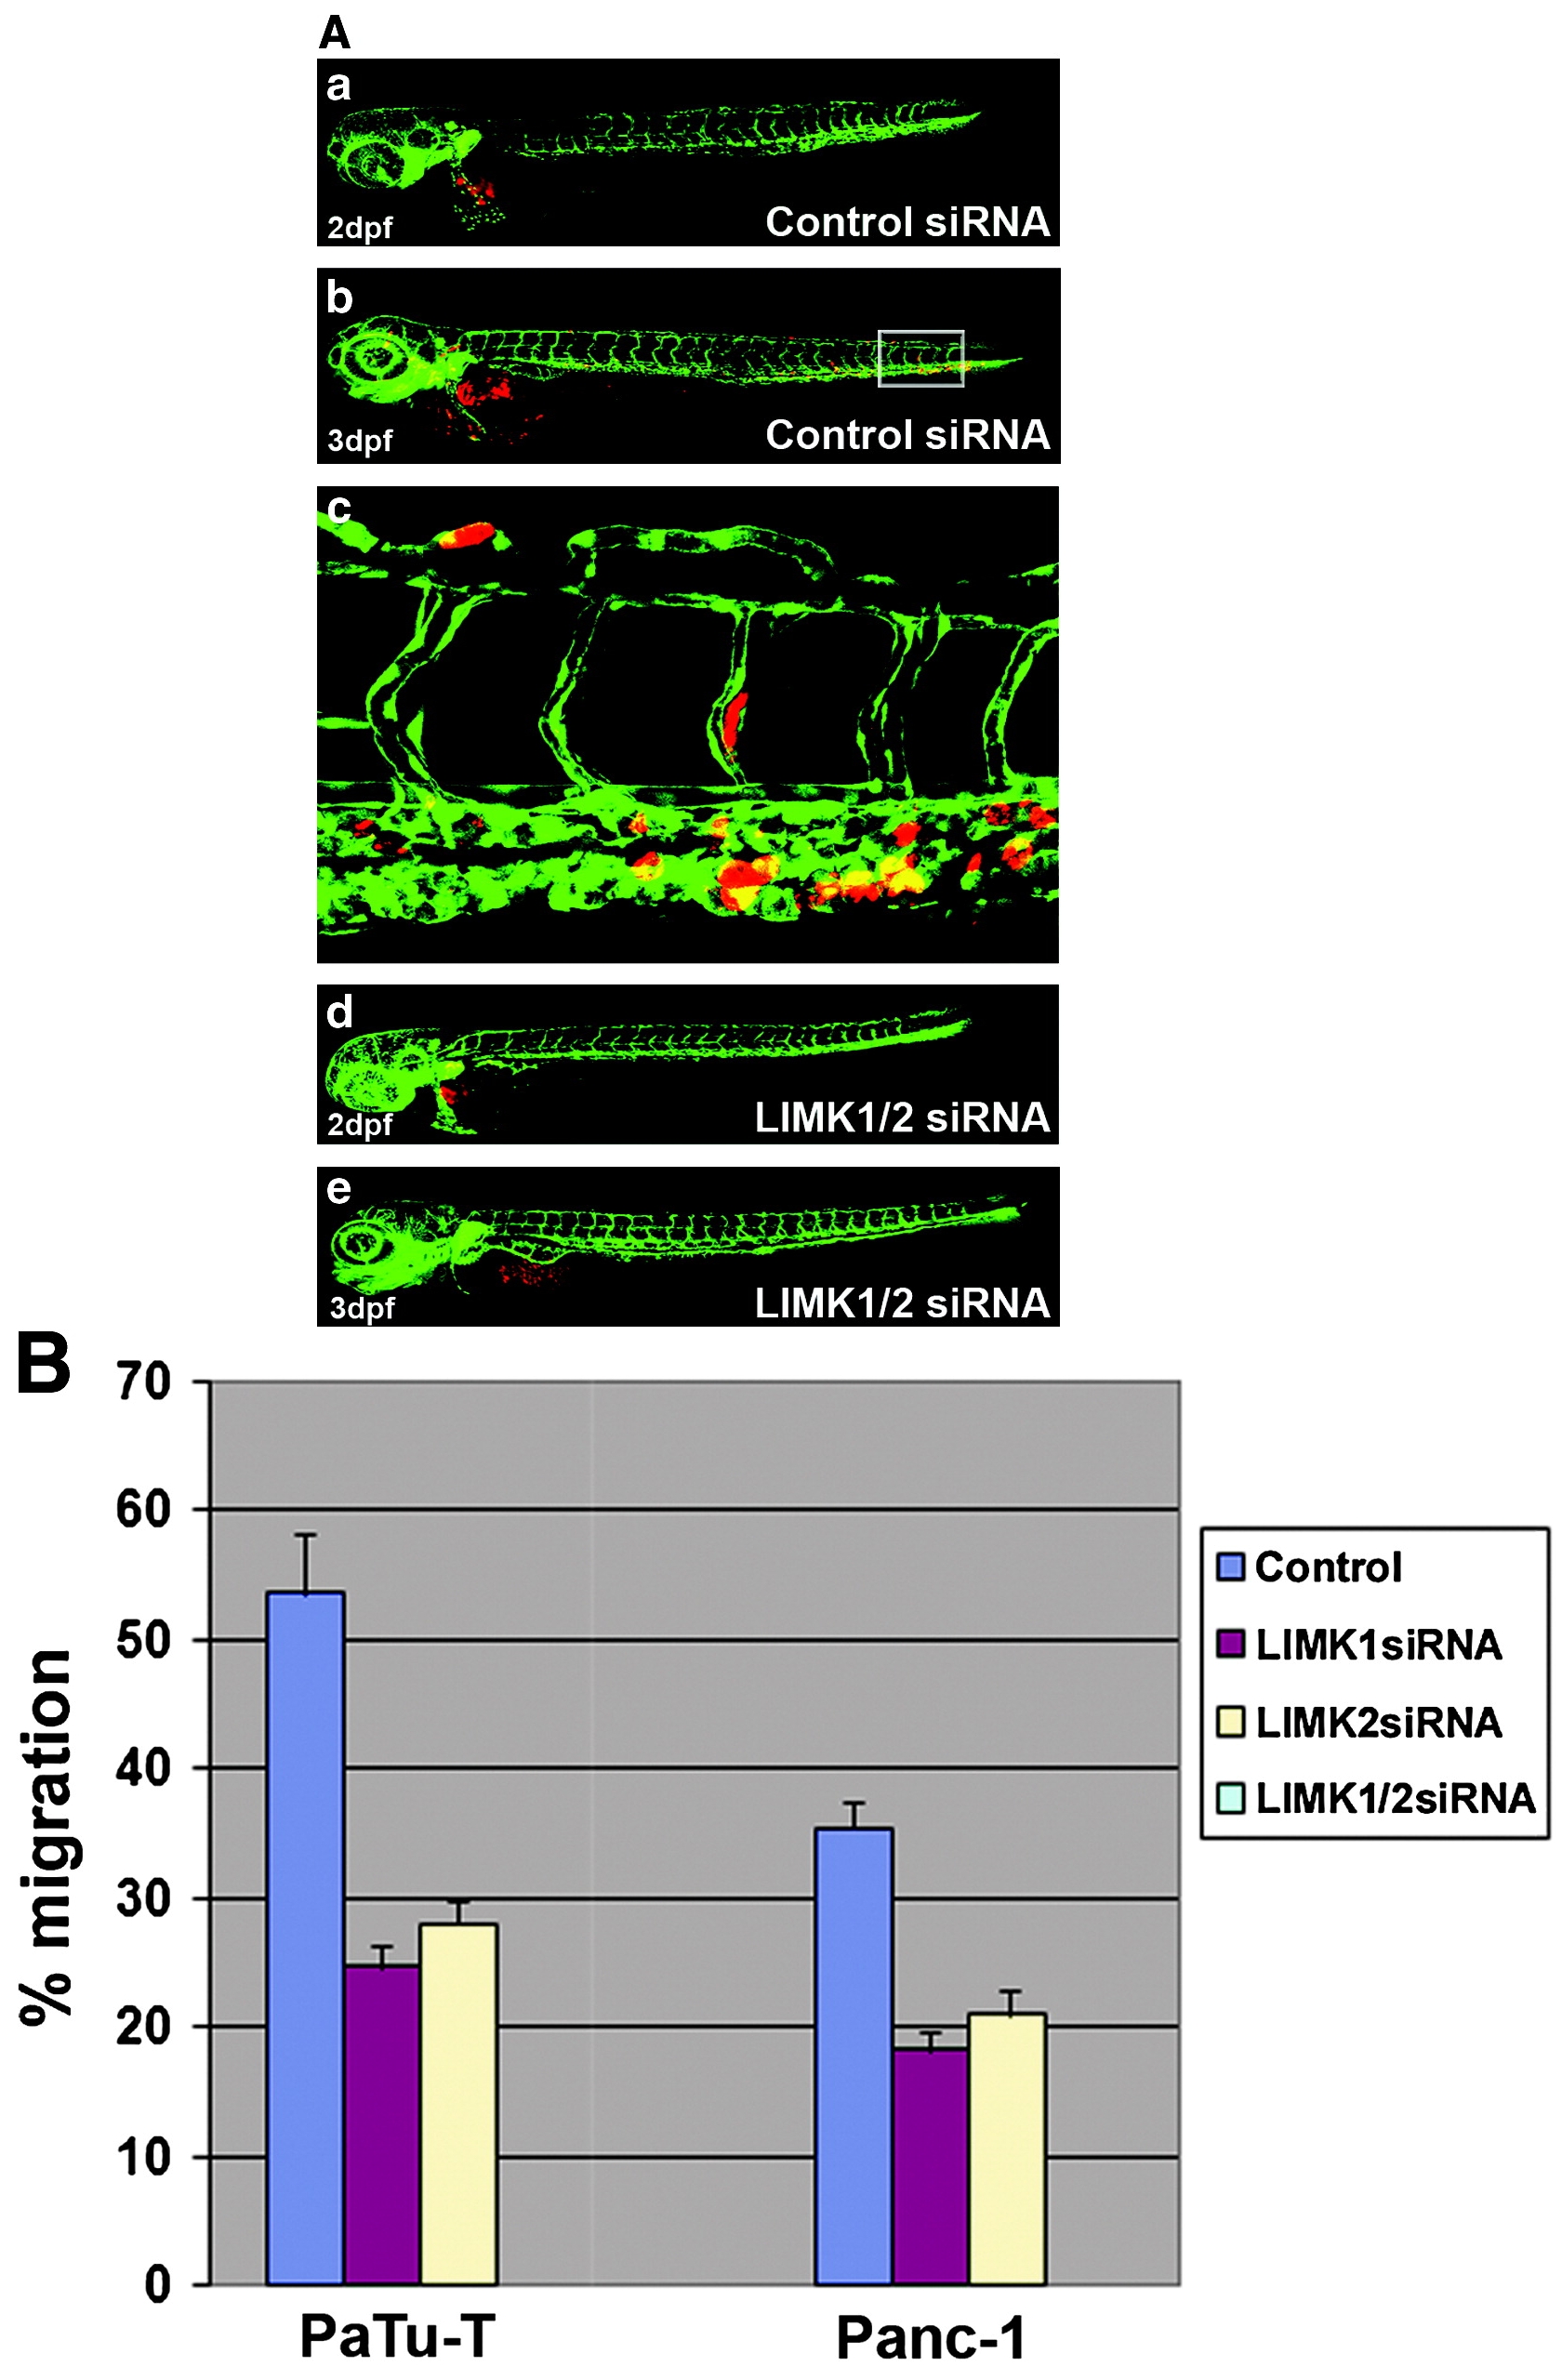
Fig. 2 The zebrafish tumor xenograft metastasis assay. (A) Pictures taken by confocal microscopy of xenotransplanted PaTu-T cells treated with either the control siRNA (a, b) or the LIMK1/2 siRNAs (d, e). The pictures show the zebrafish directly after transplantation (2dpf) and 24h later (3dpf). In the control, cancer cells have invaded the embryo and migrated to distant sites (b). This behavior is blocked by the double knockdown (e). The area marked with a square in (b) is shown as an enlargement in (c), where cancer cells are visible in the vasculature. (B) Results of the zebrafish tumor xenograft metastasis assay performed in two different pancreatic cancer cell lines. Two independent experiments were combined for each treatment and cell type. A Student′s t-test was performed which showed that all changes observed were significant (with p-values <0.01) (data not shown). The results of all experiments are shown in Supplemental Tables. dpf, days postfertilization. (Color figure is available at www.liebertonline.com.)