
- Title
-
Developmentally Regulated Impediments to Skin Reinnervation by Injured Peripheral Sensory Axon Terminals
- Authors
- O'Brien, G.S., Martin, S.M., Söllner, C., Wright, G.J., Becker, C.G., Portera-Cailliau, C., and Sagasti, A.
- Source
- Full text @ Curr. Biol.

Laser Axotomy and Imaging of Peripheral Axon Regeneration (A) Experimental design. Dorsal view of zebrafish embryo head is shown; eyes are gray, trigeminal axons are green. Arrowhead indicates site of axotomy in all panels. Axon regeneration was monitored by time-lapse for ≥12 hr, and reinnervation of the denervated territory (yellow shading) by new axon growth (red) was calculated. (B) Dorsal and lateral views of a trigeminal axon reconstructed in 3D. The axon arborizes within a mostly 2D plane. (C–G) Time series of confocal image stacks. Same axon as in (B). Time stamps are in minutes relative to axotomy at 30 hr postfertilization (hpf). Olive shading highlights the denervated region. Scale bar represents 50 μm. See Movie S1. |
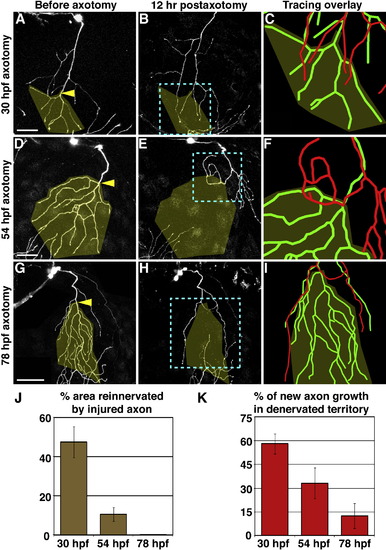
The Capacity for Reinnervation Diminishes during Development Axotomy at 30 hpf (A–C), 54 hpf (D–F), or 78 hpf (G–I). Left two columns are confocal projections. Scale bars represent 50 μm. Yellow arrowheads indicate site of axotomy, and olive overlay marks the territory that was denervated after axotomy. Blue dashed boxes indicate the area represented in rightmost panels (C, F, and I), which show 3D reconstructions of the same axon before axotomy (green) and 12 hr after axotomy (red), aligned at the shared branchpoint most proximal to the axotomy site. (J) Quantification of the average area reinnervated by injured axons, calculated as surface area of regenerated axon in denervated territory divided by surface area of denervated territory. (K) Quantification of average new axon growth that entered the denervated territory, calculated as length of new growth in denervated region divided by total length of new growth. Error bars represent ± standard error of the mean (SEM). See Table S1 and Movies S2–S4. EXPRESSION / LABELING:
|

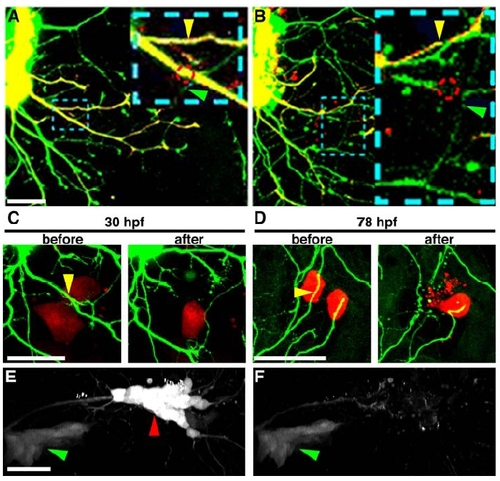
Developmental Regulation of Territory Reinnervation Strategy (A-C) Growth potential of uninjured axons is developmentally regulated. (A and B) Confocal projections. Dorsal view of zebrafish head is shown with anterior up. Olive indicates denervated half of head. Scale bars represent 50 μm. Ablation of the left trigeminal ganglion at 30 hpf (A) or 78 hpf (B) is shown. (C) Quantification of axon growth rate in unablated (olive) versus ablated (red) animals. Values are the average growth in µm/hr of individual branch tips. Error bars represent ±SEM. See Table S3 and Movies S5 and S6. (D-G) Examples of control axons (wild-type cells transplanted into wild-type host) axotomized at 30 hpf (D) or 78 hpf (F) compared to isolated regenerating axons (wild-type cells transplanted into ngn-1 morphant host) axotomized at 30 hpf (E) or 78 hpf (G). Tracing overlays as in Figure 2 are shown. Arrowhead is site of axotomy, olive marks denervated territory, and scale bars represent 50 μm. (H) Quantification of the area reinnervated by the injured axon, calculated as in Figure 2J. Error bars represent ±SEM. See Table S1 and Movies S7-S10. (I) Model of the developmental regulation of skin reinnervation by the terminal arbors of peripheral sensory axons. Black bar indicates site of axotomy. Injured axons are red; uninjured axons are green. EXPRESSION / LABELING:
|
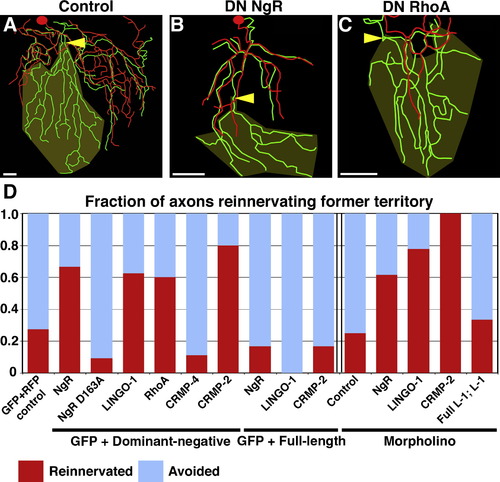
Inhibition of Skin Reinnervation by Injured Axons Is Mediated by the NgR/RhoA Pathway (A–C) Tracing overlays as in Figure 2. Arrowhead is site of axotomy, olive marks denervated territory, and scale bars represent 50 μm. Axotomy at 78 hpf of a trigeminal neuron expressing GFP and RFP (A), dominant-negative (DN) NgR (B), or DN RhoA (C) is shown. (D) Quantification of fraction of axons that entered the denervated territory. Data to the left of the double bar are from axons expressing GFP and dominant-negative or full-length versions of the genes indicated. Data to the right of the double bar are from Tg(sensory:GFP) embryos injected with indicated morpholinos. Red indicates fraction of axons that grew into denervated territory; blue indicates axons that avoided denervated territory (see Supplemental Experimental Procedures). See Table S2 and Movies S11–S13. PHENOTYPE:
|
Two-Photon Excitation Precisely Severs Axons and Causes Limited Tissue Damage |

Time-Lapse Imaging Reveals Diverse Behaviors of Regenerating Axons after 78 hpf Axotomy |

Severed Axons Persistently Fail to Innervate Denervated Territory |