
Fig. S2
- ID
- ZDB-IMAGE-100121-8
- Publication
- O'Brien et al., 2009 - Developmentally Regulated Impediments to Skin Reinnervation by Injured Peripheral Sensory Axon Terminals
- All Figures
- Figures for O'Brien et al., 2009
|
Fig. S2
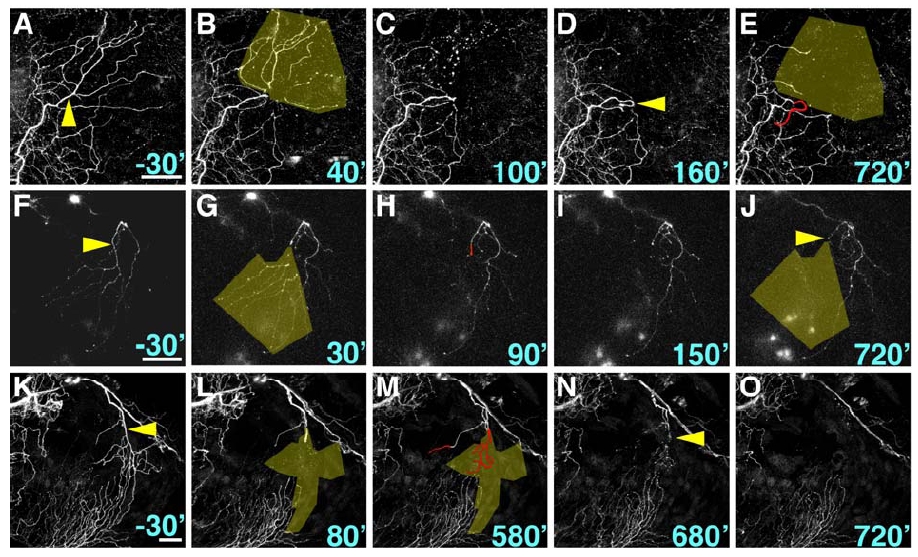
Time-Lapse Imaging Reveals Diverse Behaviors of Regenerating Axons after 78 hpf Axotomy
Time series of confocal projections, minutes relative to axotomy displayed in lower right. Panels (A), (F), and (K) show axons before axotomy, with arrowheads pointing to site of axotomy. Olive overlay highlights denervated region. In panels (E), (H), and (M), red indicates postaxotomy growth of injured axons.
(A–E) Arrowhead in (D) indicates hairpin turn of regenerating axon away from the denervated region.
(F–J) Regenerating axon enters the denervated territory (H) and retracts back out, ultimately stalling out at the boundary of the denervated territory (arrowhead in J).
(K–O) The regenerating axon partially reinnervated the denervated region by 580 min after axotomy (M), followed by death of the neuron (N–O). Arrowhead in (N) indicates the beginning of apoptotic degeneration, characterized by distal to proximal progression of axon degeneration. By 720 min after axotomy, the injured axon died, leaving a denervated region of skin. Scale bars represent 50 μm.