
Fig. 1
- ID
- ZDB-IMAGE-100121-3
- Genes
- Publication
- O'Brien et al., 2009 - Developmentally Regulated Impediments to Skin Reinnervation by Injured Peripheral Sensory Axon Terminals
- All Figures
- Figures for O'Brien et al., 2009
|
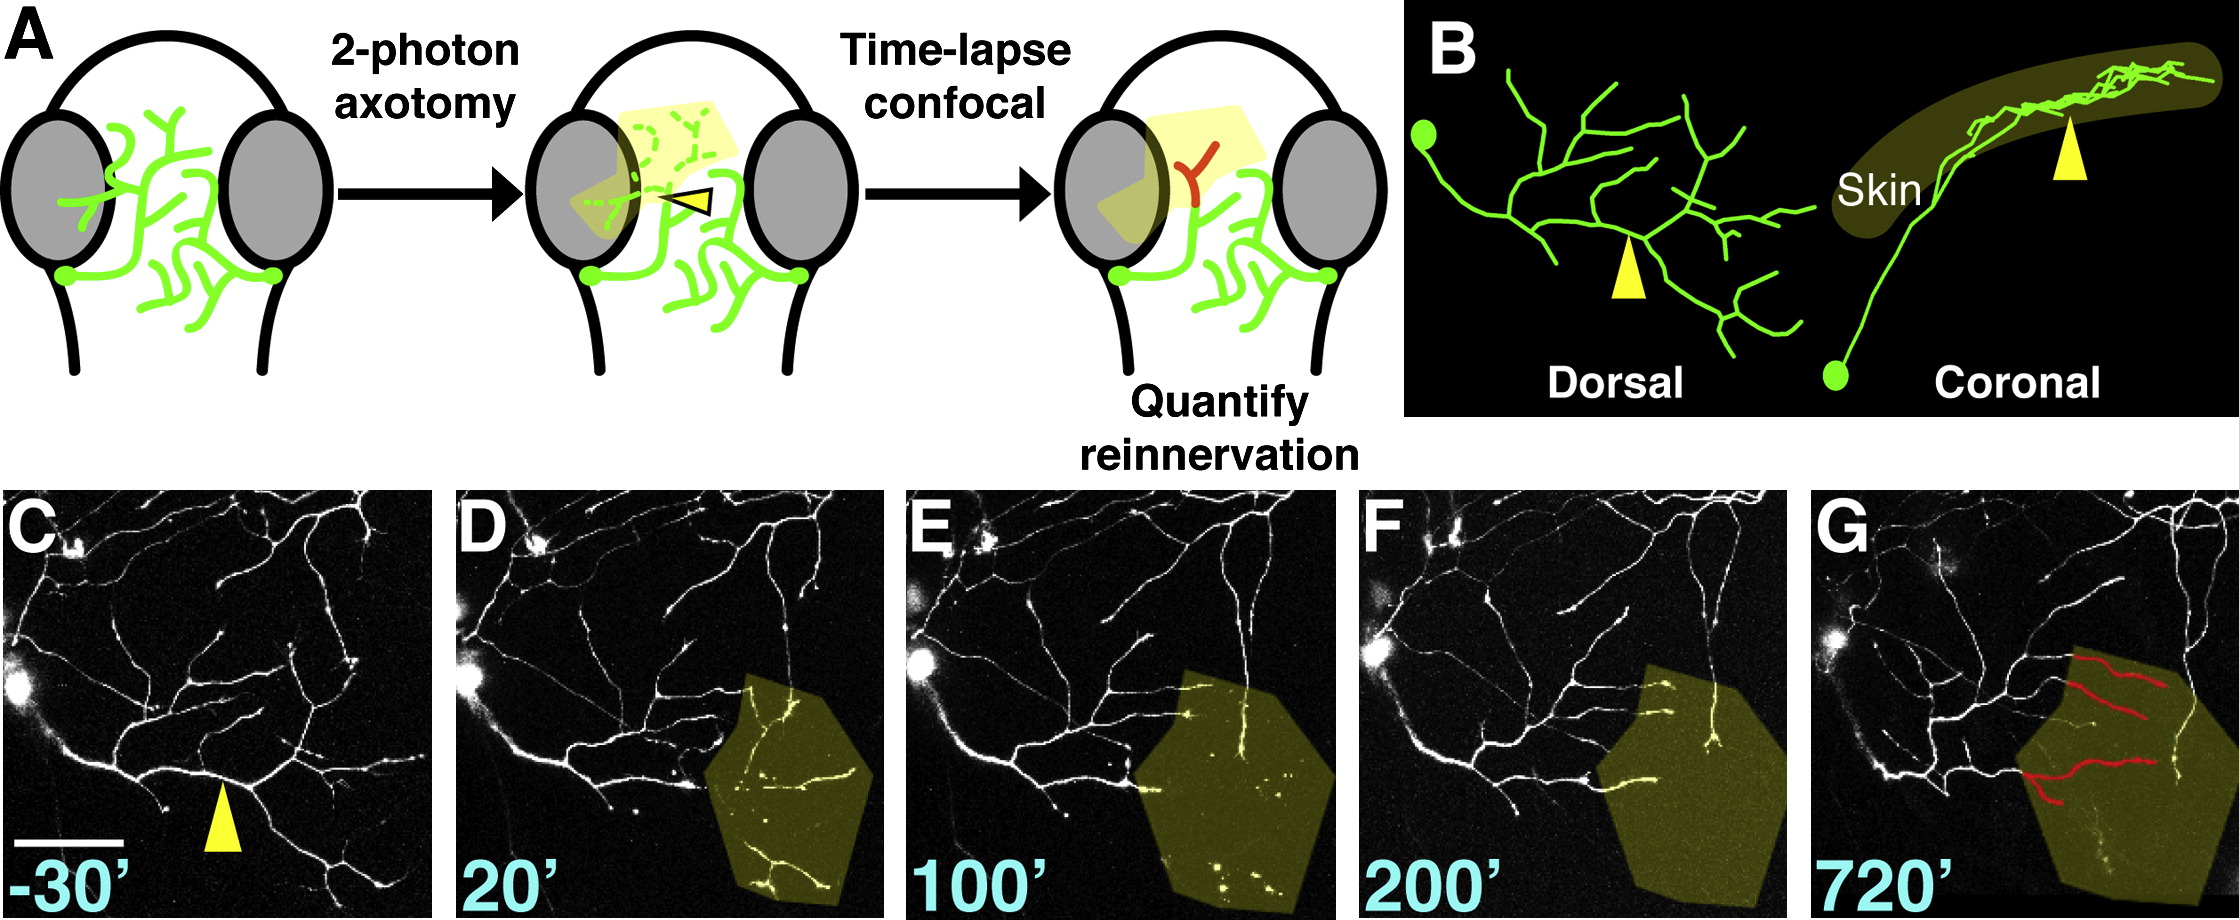
Fig. 1 Laser Axotomy and Imaging of Peripheral Axon Regeneration
(A) Experimental design. Dorsal view of zebrafish embryo head is shown; eyes are gray, trigeminal axons are green. Arrowhead indicates site of axotomy in all panels. Axon regeneration was monitored by time-lapse for ≥12 hr, and reinnervation of the denervated territory (yellow shading) by new axon growth (red) was calculated.
(B) Dorsal and lateral views of a trigeminal axon reconstructed in 3D. The axon arborizes within a mostly 2D plane.
(C–G) Time series of confocal image stacks. Same axon as in (B). Time stamps are in minutes relative to axotomy at 30 hr postfertilization (hpf). Olive shading highlights the denervated region. Scale bar represents 50 μm. See Movie S1.