
- Title
-
A critical role for myoglobin in zebrafish development
- Authors
- Vlecken, D.H., Testerink, J., Ott, E.B., Sakalis, P.A., Jaspers, R.T., and Bagowski, C.P.
- Source
- Full text @ Int. J. Dev. Biol.
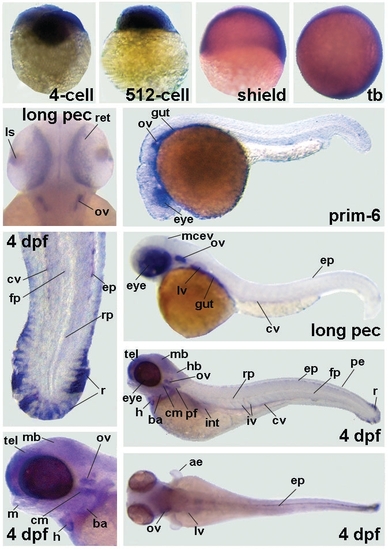
Gene expression pattern of myoglobin during zebrafish development. The early embryos shown are during cleavage period at the 4-cell stage (A) followed by the 512-cell stage (B) shortly before mid blastula transition (MBT). Mid gastrulation is represented by shield stage embryos (C) and the end of gastrulation by embryos at tail bud stage (D). Later stages shown during the pharyngula period are: prim-6 (F) and long pec stages (E,H). The early larval period is represented by embryos at 4 dpf (G-K). Abbreviations used are: ae, apical epidermis; ba, branchial arches; cm, cephalic musculature; cv, caudal vein; ep, epidermis; fp, floorplate; h, heart; int, intestine; iv, intersegmental vessels; l, liver; ls, lens; m, mandibulae; mb, midbrain; mecv, midencephalic vein; ov, otic vesicle; pe, peridermis; pf, pectoral fin bud; r, fin rays; ret, retina and rp, roofplate. dpf (G-K). Abbreviations used are: ae, apical epidermis; ba, branchial arches; cm, cephalic musculature; cv, caudal vein; ep, epidermis; fp, floorplate; h, heart; int, intestine; iv, intersegmental vessels; l, liver; ls, lens; m, mandibulae; mb, midbrain; mecv, midencephalic vein; ov, otic vesicle; pe, peridermis; pf, pectoral fin bud; r, fin rays; ret, retina and rp, roofplate. EXPRESSION / LABELING:
|

Gene expression domains of myoglobin during zebrafish development in sections of long pec and 5dpf embryos. Shown are sections of whole mount in situ hybridized embryos at the indicated stages. Abbreviations used are: basihyal (bh), ceratohyal (ch), diencephalon (di), epidermis (ep), ganglion cell layer (gcl), inner nuclear layer (inl), intermandibularis posterior (imp), intestine (int), liver (lv), meckel’s cartilage (mc), midbrain (mb), notochord (nt), optic chiasm (oc), otic vesicle (ov), palatoquadrate (pq), pancreas (p), sensory epithelium (se), somites (som) and telencephalon (tel). |
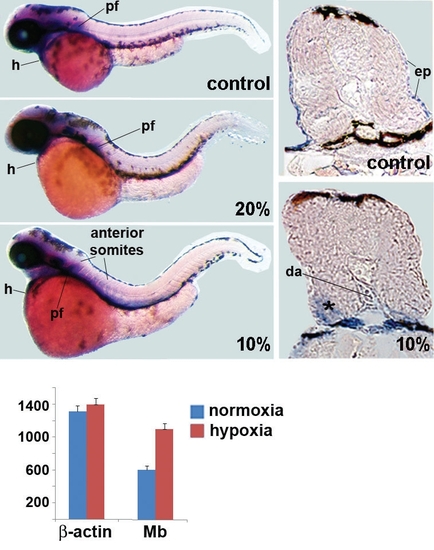
Influence of hypoxia on myoglobin (Mb) gene expression in zebrafish embryos. Zebrafish embryos were exposed to two different oxygen concentrations (10% and 20% air saturated). Controls were kept at 100% air saturated. Embryos were fixed at 48 hpf for the control (A) and the 20% air saturated water embryos (C) and at 4 dpf for the 10% air saturated water embryos (E) (which were strongly delayed in development). Fixed embryos were subjected to whole mount in situ hybridization. Blue and purple staining indicates myoglobin expression. Similar results were seen in five different specimen and staining in the anterior somites was never observed in control or 20% air saturated water embryos. Staining in the pectoral fins (pf) and in the heart (h) is indicated for all embryos and anterior somites and the dorsal aorta (da) are marked in the 10% air saturated water embryos. In addition, shown are sections of the anterior somite area of control embryos (B) and embryos exposed to 10% air saturated water (D). The latter shows stronger staining in regions of the anterior somites supporting the results of the whole mount pictures. Skeletal muscles are indicated with an asterisk and staining in the dorsal aorta (da) (D). The quantitative RT-PCR results for 48 hpf embryos under normoxic conditions or exposed to hypoxia (10%) are shown in (F). Relative expression of myoglobin is given based on normalization to β-actin. A standard curve for β-actin was included in the experiments. Data represents two independent experiments each done in triplicates. In 48 hpf embryos, 10% hypoxia led to a 1.7 fold induction of Mb normalized to actin (SD± 0.06). |

Effects of microinjection of myoglobin gene-specific Mo on zebrafish development. Shown are stereoscope pictures and DIC microscopy pictures of embryos and larvae at different stages of development. Embryos were injected at the one-cell stage with either a control Mo or the Mb specific MO (examples shown were injected with Mb-MO (2 ng/embryo (C,D,F,I and M) or 4 ng/embryo (J,L and N) or control MO (4 ng) were used as indicated). PHENOTYPE:
|

Effects of microinjection of myoglobin gene-specific morpholinos in Tg:fli1/eGFP and Gut/GFP transgenic fish. Tg:fli1/eGFP embryos (A, D-J) and Gut/GFP (Tg:ef-1α/eGFP) (B,C,K) were injected with 4 ng/embryo of either Control Morpholino (Co) or Mb specific Morpholino (Mo) as indicated. Zebrafish larvae at three different time points are shown: 3 dpf, 4 dpf and 5 dpf. The fluorescent gut is not well visible before 4 dpf. All pictures show confocal images of representative examples for control and knock down embryos. Higher magnification images (H,J) give examples for a control (H) and an Mb knock down (J) embryo, respectively. An asterisk is used to mark representative sites of vascular defects (E-G, I,J) (not all defects are marked). PHENOTYPE:
|