
|
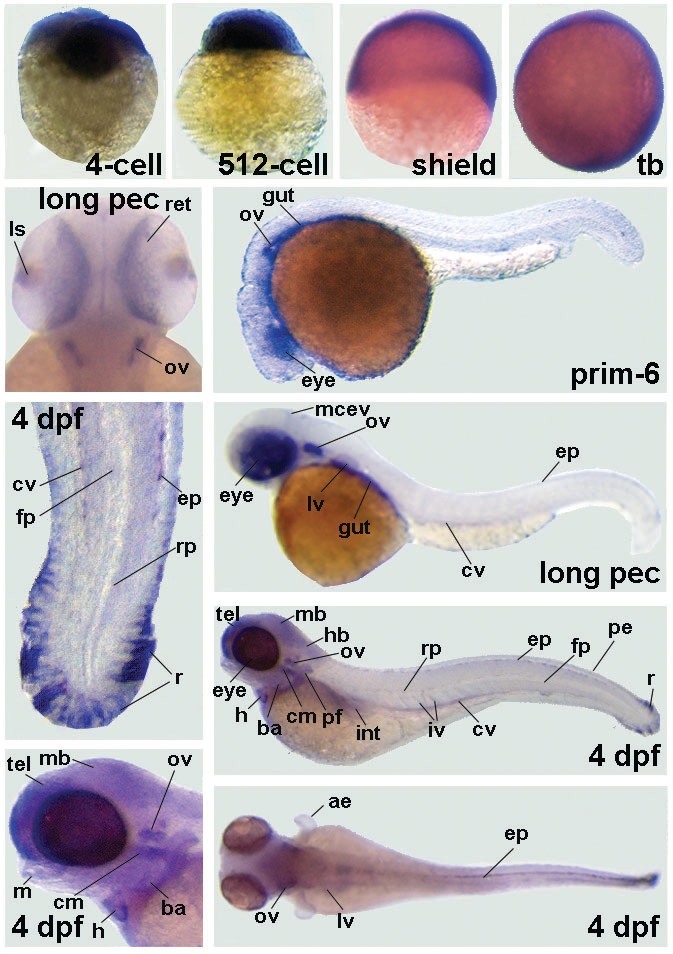
Fig. 2 Gene expression pattern of myoglobin during zebrafish development. The early embryos shown are during cleavage period at the 4-cell stage (A) followed by the 512-cell stage (B) shortly before mid blastula transition (MBT). Mid gastrulation is represented by shield stage embryos (C) and the end of gastrulation by embryos at tail bud stage (D). Later stages shown during the pharyngula period are: prim-6 (F) and long pec stages (E,H). The early larval period is represented by embryos at 4 dpf (G-K). Abbreviations used are: ae, apical epidermis; ba, branchial arches; cm, cephalic musculature; cv, caudal vein; ep, epidermis; fp, floorplate; h, heart; int, intestine; iv, intersegmental vessels; l, liver; ls, lens; m, mandibulae; mb, midbrain; mecv, midencephalic vein; ov, otic vesicle; pe, peridermis; pf, pectoral fin bud; r, fin rays; ret, retina and rp, roofplate. dpf (G-K). Abbreviations used are: ae, apical epidermis; ba, branchial arches; cm, cephalic musculature; cv, caudal vein; ep, epidermis; fp, floorplate; h, heart; int, intestine; iv, intersegmental vessels; l, liver; ls, lens; m, mandibulae; mb, midbrain; mecv, midencephalic vein; ov, otic vesicle; pe, peridermis; pf, pectoral fin bud; r, fin rays; ret, retina and rp, roofplate.