
- Title
-
Spatially regulated expression of three receptor tyrosine kinase genes during gastrulation in the zebrafish
- Authors
- Xu, Q., Holder, N., Patient, R., and Wilson, S.W.
- Source
- Full text @ Development
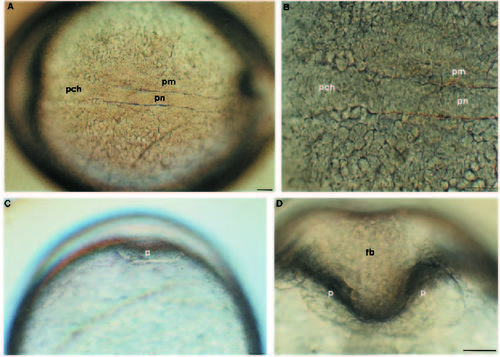
Axial hypoblast at the end of epiboly. Living zebrafish embryos at 9.5 h (A-C) and 11.5 h (D). Anterior is to the left in A and B; C and D are vegetal views looking at the head region. (A) Dorsal view of an embryo focused on the hypoblast. Presumptive notochord has segregated from paraxial mesoderm. (B) Axial hypoblast beneath the future hindbrain/midbrain. Anterior to the presumptive notochord, prechordal axial hypoblast continues as a strip towards the front of the embryo. (C,D) The ‘pillow’ of anterior hypoblast. At the end of epiboly there is a disclike accumulation of cells at the very anteriormost tip of the embryo (C). A few hours later, the forebrain has formed a depression in the anterior hypoblast giving the pillow its characteristic shape (D). Abbreviations: fb, forebrain; pn, presumptive notochord; pch, prechordal hypoblast; pm, paraxial mesoderm. Scale bars: 50 µm. |
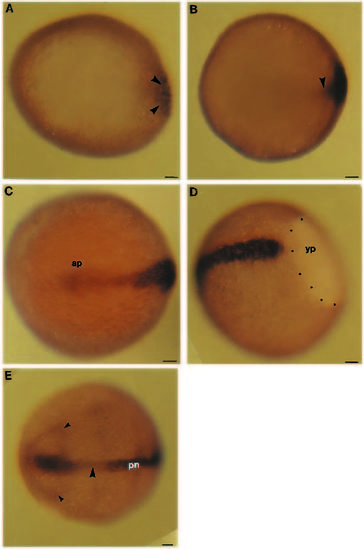
Expression of rtk1 during gastrulation. Wholemounted embryos labelled with an antisense RNA probe to rtk1. Viewed from animal pole (except D) with the future anterior end of the embryo to the left. (A) 50% epiboly. Transcripts (arrowheads) are detected at a restricted region of the germ ring. (B) 50-60% epiboly. Transcripts begin to accumulate along the developing axis of the embryo (arrowhead). (C,D) 75-85% epiboly. Transcripts are detectable along the elongating axis. Labelling at the animal pole in C is out of the plane of focus of the photograph. In D, the embryo is tilted to show the relationship of rtk1 transcripts to the yolk cell. (E) 100% epiboly. Transcripts are still detectable along the entire axis but labelling intensity is much reduced at the level of the future midbrain/anterior hindbrain (large arrowhead). The small arrowheads indicate transcripts within the neural plate. Abbreviations: ap, animal pole; pn, presumptive notochord; yp, yolk plug. Scale bars: 50 µm. |
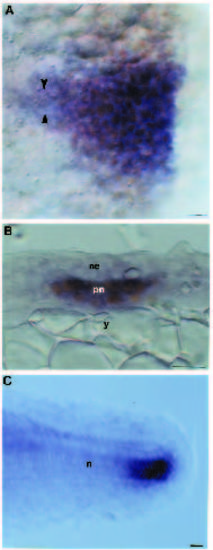
Relationship of rtk1 expression to the developing notochord. Whole-mounted embryos labelled with an antisense RNA probe to rtk1 (A-C) and antibody to Ntl (A,B). Anterior is to the left in A and C and dorsal is up in B and C. (A) 60% epiboly. rtk1 transcripts (blue) and Ntl protein (brown) are colocalised at the shield, although rtk1 expression is detectable along the axis slightly anterior (arrowheads) to Ntl-containing cells. Ntl is also within germ ring cells lateral to the shield. (B) Transverse section through the presumptive notochord. rtk1 is expressed in the same cells that contain Ntl protein. (C) rtk1 expression is downregulated as the notochord differentiates but continues to be expressed in presumptive notochord cells of the extending tail bud. Abbreviations: n, notochord, ne, neuroepithelium; pn, presumptive notochord; y, yolk. Scale bars: 25 µm. |
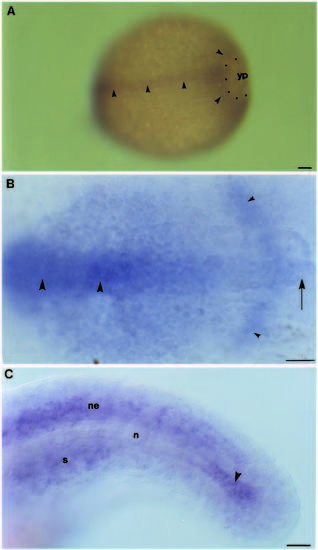
Expression of rtk2 during gastrulation. Whole-mounted embryos labelled with an antisense RNA probe to rtk2. Anterior is to the left. (A) 80-90% epiboly. rtk2 transcripts (arrowheads) are present along the entire axis and in cells surrounding the yolk cell. (B) Flat-mounted preparation of the presumptive head region at the end of epiboly. Slightly higher levels of rtk2 transcripts are present anteriorly (large arrowheads) than are present posteriorly (arrow) beneath the presumptive hindbrain. rtk2 expression is also apparent in lateral regions of the neural plate (small arrowheads). (C) 22 hour embryo. rtk2 expression is downregulated as the notochord differentiates but continues to be expressed in presumptive notochord cells of the extending tail bud. Transcripts are also present in the neural epithelium and in paraxial mesoderm (sectioned tissue suggests that this staining is in the sclerotome). Abbreviations: n, notochord; ne, neural epithelium; s, somite; yp, yolk plug. Scale bars: 50 µm. EXPRESSION / LABELING:
|
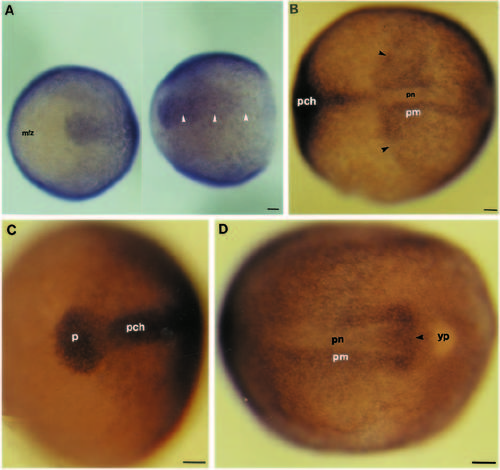
Expression of rtk3 during gastrulation. Whole-mounted embryos labelled with an antisense RNA probe to rtk3. The future anterior end of embryos is to the left. (A) Two views of the same embryo at around 80% epiboly. The first panel shows an anterior end view, the second panel is a view of the dorsal side of the embryo. Spatially restricted rtk3 transcripts are detectable at the leading edge of the involuting hypoblast (white arrowheads). (B-D) 100% epiboly. (B) View of the dorsal side of the embryo. rtk3 expression is present in paraxial mesoderm posterior to a sharp boundary (arrowheads) and in axial regions of the head. (C) View of the head region of the embryo. rtk3 expression is present in prechordal axial hypoblast and the pillow. (D) View of the posterior end of the embryo. rtk3 transcripts are apparent in cells around the posterior tip of the presumptive notochord (arrowhead) but are not detectable in the presumptive notochord itself. Abbreviations: mfz, mesoderm-free zone; p, pillow; pch, prechordal hypoblast; pm, paraxial mesoderm; pn, presumptive notochord; yp, yolk plug. Scale bars: 50 µm. EXPRESSION / LABELING:
|
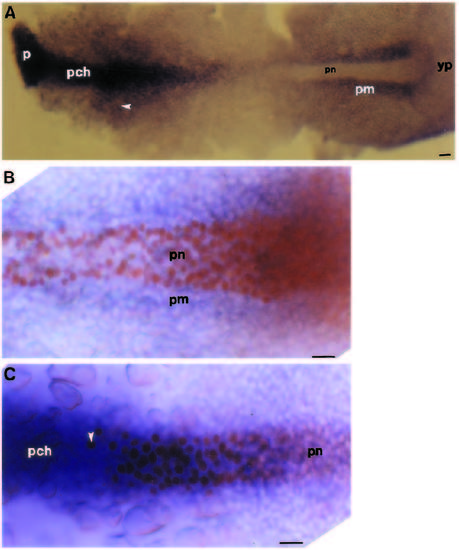
Relationship of rtk3 expression to the presumptive notochord. Whole-mounted embryos at 100% epiboly labelled with an antisense RNA probe to rtk3 (A-C) and an antibody to Ntl (B,C). Anterior is to the left. (A) Flat-mounted preparation. rtk3 transcripts are present at high levels in axial tissue anteriorly and paraxial tissue posteriorly. Some expression is also detectable in paraxial tissue of the head (arrowhead). (B) Posterior end of the embryo. rtk3 is expressed in paraxial mesoderm adjacent to the Ntl-containing cells of the presumptive notochord. C) Hindbrain region. The most anterior Ntl-containing cell (arrowhead) is within the posterior axial expression domain of rtk3. Abbreviations: p, pillow; pch, prechordal hypoblast; pm, paraxial mesoderm; pn, presumptive notochord; yp, yolk plug. Scale bars: 25 µm. EXPRESSION / LABELING:
|

Effect of lithium treatment upon rtk gene expression. (A) Schematic of a severely dorsalized (radialized) embryo at about 12 hours of development. The embryo is symmetrical around its circumference and forms a mound of cells on top of the yolk. The dotted line indicates the extent of the yolk inside the domed embryo. (B-F) Completely radialized embryos labelled with antibody to Ntl (brown) and probes to rtk genes or goosecoid (blue). The approximate anterior limits of Ntl protein and posterior limits of rtk gene expression are indicated with white and black arrowheads respectively. (B) Animal pole view of an embryo labelled with antibody to Ntl plus an RNA probe to goosecoid. Goosecoid is expressed in the most anterior hypoblast at the top of the dome, Ntl protein is present in a ring around the goosecoid-expressing cells. The dotted line indicates the cuts made in such an embryo to produce a flat mount similar to that in C. D-F show similar flat mounts. (C) Ntl plus goosecoid. (D) Ntl plus rtk1. (E) Ntl plus rtk2. (F) Ntl plus rtk3. Scale bars, 50 µm. Abbreviations: a, anterior; p, posterior; y, yolk EXPRESSION / LABELING:
PHENOTYPE:
|

Unillustrated author statements EXPRESSION / LABELING:
PHENOTYPE:
|