
Fig. 6
- ID
- ZDB-FIG-141027-5
- Publication
- Xu et al., 1994 - Spatially regulated expression of three receptor tyrosine kinase genes during gastrulation in the zebrafish
- Other Figures
- All Figure Page
- Back to All Figure Page
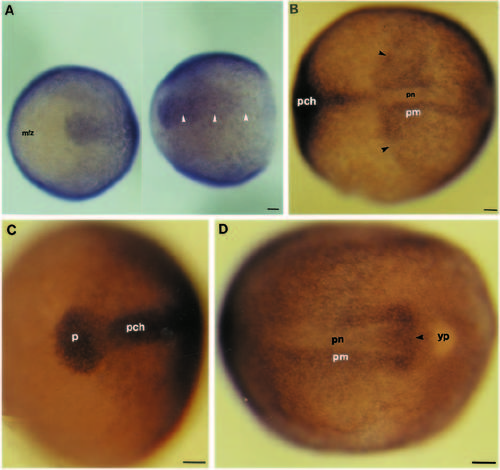
Expression of rtk3 during gastrulation. Whole-mounted embryos labelled with an antisense RNA probe to rtk3. The future anterior end of embryos is to the left. (A) Two views of the same embryo at around 80% epiboly. The first panel shows an anterior end view, the second panel is a view of the dorsal side of the embryo. Spatially restricted rtk3 transcripts are detectable at the leading edge of the involuting hypoblast (white arrowheads). (B-D) 100% epiboly. (B) View of the dorsal side of the embryo. rtk3 expression is present in paraxial mesoderm posterior to a sharp boundary (arrowheads) and in axial regions of the head. (C) View of the head region of the embryo. rtk3 expression is present in prechordal axial hypoblast and the pillow. (D) View of the posterior end of the embryo. rtk3 transcripts are apparent in cells around the posterior tip of the presumptive notochord (arrowhead) but are not detectable in the presumptive notochord itself. Abbreviations: mfz, mesoderm-free zone; p, pillow; pch, prechordal hypoblast; pm, paraxial mesoderm; pn, presumptive notochord; yp, yolk plug. Scale bars: 50 µm. |
| Gene: | |
|---|---|
| Fish: | |
| Anatomical Terms: | |
| Stage Range: | 75%-epiboly to Bud |