- Title
-
Characterization of three sialidases from Danio rerio
- Authors
- Forcella, M., Manzoni, M., Benaglia, G., Bonanomi, M., Giacopuzzi, E., Papini, N., Bresciani, R., Fusi, P., Borsani, G., Monti, E.
- Source
- Full text @ Biochimie
|
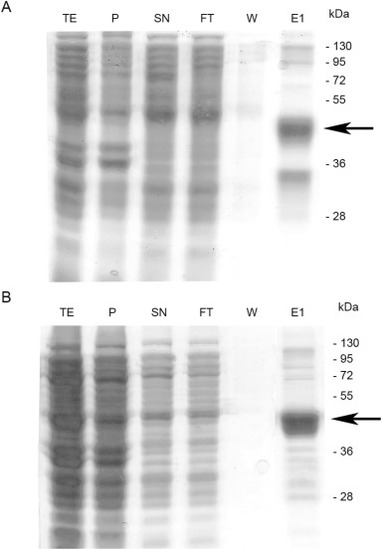
Purification Neu3.2 (A) and Neu3.3 (B). Protein samples were separated by SDS-PAGE: 20 ?g of total extract (TE), pellet (P), 15 ?g of supernatant (SN), 12 ?g of flow through (FT), 5 ?g of wash (W), 3 ?g of first elution (E1). The arrow indicates the protein purified. |
|
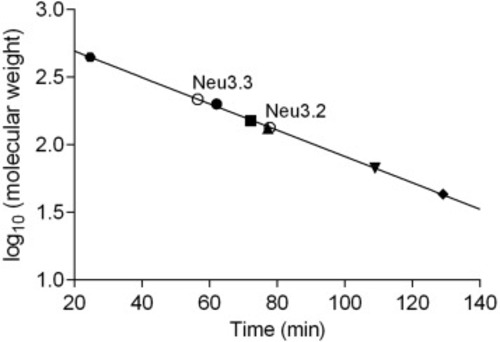
The aggregation state of recombinant Neu3.2 and Neu3.3. Aliquots of the purified recombinant enzymes (?) were subjected to gel filtration analysis on Superdex 200 HR 10/300. Calibration curve was obtained using the following proteins as molecular weight standards: apoferritin 443 kDa (?), ?-amylase 200 kDa (?), alcohol dehydrogenase 150 kDa (?), albumin as monomer 67 kDa (?) and dimer 134 kDa (?) and ovalbumin 43 KDa (?). For details see Material and Methods. |
|
Sialidase activity of purified recombinant Neu3.2 and Neu3.3 toward the natural substrates GD1a, GD3, GM1 and GM3 ganglioside, fetuin, mucin, ?(2,3) sialyllactose and 3-sialyllactose. Values are means ± SD of three independent experiments. |
|
Inhibition assay of zebrafish Neu3.2 and Neu3.3. Sialidase activity of Neu3.2 (A) and Neu3.3 (B) was measured using 4MU-NANA as substrate (control) and in presence of two concentrations of the competitive inhibitor DANA. The kinetic parameters Km and Vmax for the artificial fluorescent substrate of the two paralogs and the corresponding Ki values are reported in C and D, respectively. |
|
Ribbon diagram of Hs NEU2 and Dr Neu3.1, 2 and 3 viewed by the side. The active site is located on the top part of the proteins; NEU2 structure (left) shows the competitive inhibitor DANA (violet), as well as the side chain of Asp 46 and Glu 111 (red) located in the mobile loops bearing ?1 and ?2 helices (PDB code 1VCU). The 3D structural features of the Dr Neus obtained by molecular modelling show a more complex network of unordered segments. The amino and carboxy terminus are indicated by Nt and Ct, respectively. Color code: ?-strands yellow; ?-helix red; unordered green. |
|
Overlay of the amino acid residues in the active site crevice of Hs NEU2/DANA complex (PDB ID 1VCU) with the predicted 3D structures of Dr Neu3.1, 2 and 3. View from the top: the carbon backbone of the active site residues of Hs NEU2, Dr Neu3.1, Dr Neu3.2 and Dr Neu3.3 are colored in green, light blue, grey and yellow, respectively, whereas the competitive inhibitor DANA is colored in red. The amino acid numbers are referred to Hs NEU2 [13]. |
|
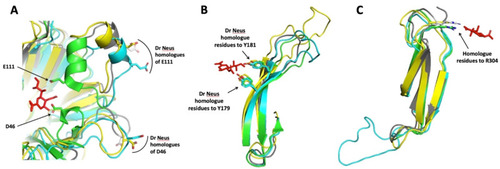
Superimposition of portions of NEU2/DANA complex crystal structure (PDB ID 1VCU) with Dr Neus predicted structures. (A) Overlapping of Hs NEU2 portion bearing the D46 and E111 residues with Dr Neu3.1, 2 and 3. The competitive inhibitor DANA interacts with the side chains of these acidic residues, located in ?-helix portions of two mobile loops [13]. The homologue residues of Dr Neus 3D models are located in loops far away from the active site crevice. An ?-helix portion is present only in the loop containing E111, as expected by the sugar-induced form of Hs NEU2 (PBD ID 1SO7) used as a template for modelling. (B) DANA interacts with the hydroxyl groups of tyrosine 179 and 181 and the aromatic residues, located in beta sheets B (174?182) and C (191?199) of the third blade of the propeller [13]. The homologue residue positions are highly conserved in Dr Neus. Note the variable and increasing length of the loop connecting the two antiparallel beta sheets. (C) DANA interacts with the side chain terminal portion of the arginine 304 [13] and the homologue residues of Dr Neus are located in topologically equivalent positions. Note the difference in the length of the loop connecting beta sheets A (275?280) and B (291?298) of the fifth blade of the propeller in Dr Neu3.1 compared to the other sialidases. The amino acid numbers are referred to Hs NEU2 [13]. Color code: DANA red, Hs NEU2 green; Dr Neu3.1 light blue; Dr Neu3.2 grey and Dr Neu3.3 yellow. |
|
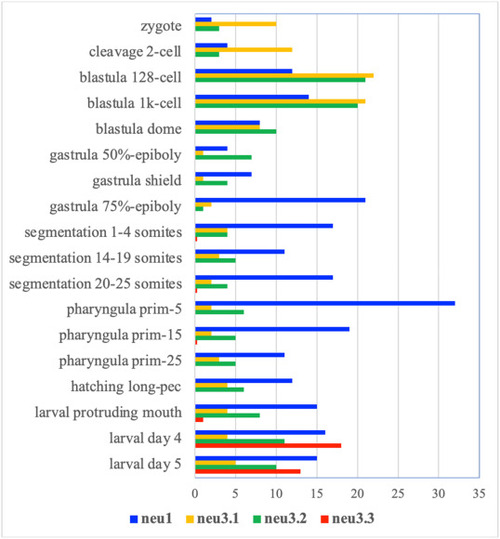
Expression levels of neu1, neu3.1, neu3.2 and neu3.3 sialidase genes during zebrafish development. The temporal expression profiles were extracted from the ?Baseline expression from transcriptional profiling of zebrafish developmental stages? RNA-Seq dataset generated by the Wellcome Trust Sanger Institute [27]. The study produced temporal expression profiles of 23,642 zebrafish genes across 18 developmental time points (from 1 cell to 5 days post-fertilization) sampling individual and pools of embryos (5 biological replicate per time point). On the X-axis, normalized transcript counts per gene are expressed as Transcripts Per Million (TPM). |


