FIGURE SUMMARY
Title

Transformed notochordal cells trigger chronic wounds destabilizing the vertebral column and bone homeostasis

Authors
López-Cuevas, P., Deane, L., Yang, Y., Hammond, C.L., Kague, E.
Source
Full text @ Dis. Model. Mech.

kita drives RAS expression in the notochord,inducing fibrosis and wound-like phenotype. (A) Schematic of the wild-type notochord. The notochord is a rod tube formed by a sealing notochord sheath epithelium (nse) layer that wraps the notochord vacuolated cells (nvc). dpf, days post-fertilisation. (B) Maximum projections from confocal images of control (kita:mCherry) and kita-RAS-mCherry (kita-RAS) at 5 dpf. kita drives expression of the reporter and RAS in the notochord cells (magenta arrows), leading to dramatic changes in the notochord. Gaps between vacuolated notochord cells (blue arrows) are filled with small non-vacuolated cells. (C) Histological sections of 5 dpf control (kita-mCherry) and kita-RAS larvae, stained with Toluidine Blue (T Blue) and AFOG. Control fish show an intact nse. kita-RAS larvae show disruptions of the nse (arrowheads), accumulation of non-vacuolated cells within the notochord (arrow) and fibrous tissue (AFOG, dashed line arrow). (D) Cross section from confocal images of kita (control) and kita-RAS at 5 dpf, treated with EdU from 2 dpf to 4 dpf to show cell proliferation. Note increased proliferation in the notochord sheath (arrowhead) and within wounded areas of the notochord (arrow). (E) Quantification of cell proliferation was performed by counting the number of EdU+ cells in the control (n=8) and kita-RAS (n=9). Nonparametric t-test, post hoc Mann–Whitney test; data are mean±s.d. Scale bars: 50 µm.

Transformed notochord cells alter the organisation of the sheath layer and activate wound repair mechanisms. (A) Schematic of the notochord and notochord sheath epithelium (nse) at 5 dpf, formed by cells that highly express collagen type IX. (B) Confocal images showing maximum projections (Max proj) and cross sections (C section) of col9a2:GFPCaaX (nse) and kita-mCherry (notochord cells) in control and kita-RAS, at 5 dpf. In kita-RAS, a ‘scar’ region within the notochord (arrowheads) expresses col9a2, and shows connectivity with the nse (arrows). (C) The areas (white dashed lines) of notochord sheath cells were analysed in controls and within two regions of kita-RAS expressing col9a2:GFPCaaX: proximal (wp; magenta dashed line) and distal (wd; magenta solid line) to the wound (arrowhead). (D) Cell area quantification of each group (ten cells were measured for each group and region, and n=10 fish per group). Nested one-way ANOVA and Tukey's multiple comparisons test were used for statistical analysis. Data are mean±s.d. P-values are indicated when significant (P<0.05). (E) Maximum projections from confocal images showing expression of wt1b:gfp in the wounded regions (arrowheads) of kita-RAS. w1b is not expressed in controls. Scale bars: 50 µm.

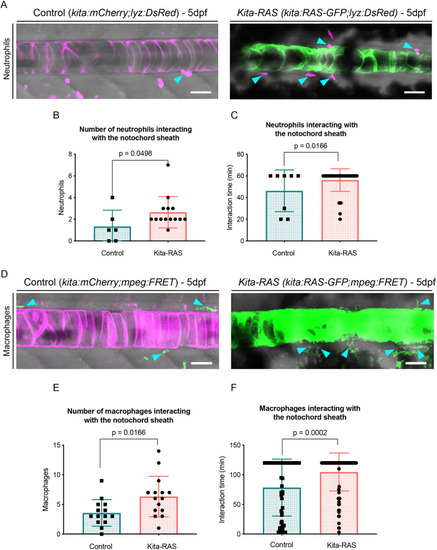
Maximum projections from confocal images of the notochord at 5 dpf in control (kita-mCherry) and kita-RAS, showing neutrophils (cyan arrowheads) interacting by contact with the notochord sheath layer. (B) Numbers of neutrophils interacting with the notochord sheath during the time lapse (controls n=6 fish, kita-RAS n=14 fish). (C) Interaction time between neutrophils and the notochord sheath during the time-lapse movies. Each dot or square represents one neutrophil (controls n=8 neutrophils, n=4 fish; kita-RAS n=39 neutrophils, n=14 fish). (D) Maximum projections from confocal images of the notochord of 5 dpf control (kita-mCherry) and kita-RAS fish, showing macrophages (cyan arrowheads) interacting by contact with the notochord sheath. (E) Numbers of macrophages interacting with the notochord sheath during the time lapse (controls n=14 fish, kita-RAS n=15 fish). (F) Interaction time between macrophages and the notochord sheath during the time-lapse movies. Each dot or square represents one macrophage (controls n=51 macrophages, n=13 fish; kita-RAS n=95 macrophages, n=15 fish). Unpaired, nonparametric t-test and Mann–Whitney test were used for all charts. Data are mean±s.d.; P-values are indicated when significant (P<0.05). Scale bars: 50 µm.

Modulation of the innate immune response prevents chordoma. (A) Schematics of the experiment. kita-RAS-GFP were incrossed, and embryos from the same cross were divided into three groups: controls, morpholinos (MO) or CRISPR targeting pu.1+gcsfr (for depletion of neutrophils and macrophages). Injections were carried out at one-cell stage. The notochords were subsequently imaged and analysed at 5 dpf. (B) Percentage of neutrophils per area in kita-RAS (control group n=26) and kita-RAS injected with either MO (n=9) or CRISPR (n=15). (C) Numbers of macrophages in kita-RAS (n=14) and kita-RAS injected with either MO (n=15) or CRISPR (n=19). (D) For quantification of neutrophils and macrophages, injections were carried out in Tg(lyz:DsRed;mpeg:FRET:kita:mCherry). Percentage of neutrophils was calculated within the selected area (regions within the red dashed lines), after image binarisation. Numbers of macrophages were manually counted in the dorsal fin area (regions within the red dashed lines). Images are displayed with inverted colour and in black and white for better visualisation. Scale bars: 250 µm. (E) Cell proliferation was quantified from confocal images, by counting numbers of EdU+ cells in kita (control) (n=9), kita-RAS (control for injections) (n=12) and kita-RAS injected with MO (n=8) or CRISPR (n=9). (F) Maximum projections from confocal images to show cell proliferation in each of the experimental groups. Scale bars: 50 µm. (G) Computational analysis was performed on images acquired under a stereomicroscope at 5 dpf, and was based on the intensity profile derived from the fluorescence of the identified notochord (red lines). Peaks along the notochord represent the intensity profile. Lesions are identified by higher pixel intensity and broader area under the peak. x- and y-axes show numbers of pixels and serve as scale bars. (H) Violin plot showing quantification of notochord lesions and rescue of notochord phenotype in kita-RAS (control for injections) (n=140) and kita-RAS injected with MO (n=41) or CRISPR (n=105) in comparison to kita (control) (n=52). Note that MO rescued the notochord phenotype, whereas CRISPR injections only partially rescued the notochord. In B, C, E and H, we used nonparametric, one-way ANOVA, Kruskal–Wallis test, followed by Dunn's multiple comparison test. P-values are shown when significant (P<0.05). In B, C and E, data are mean±s.d., generated in Prism 8. H was generated in Python.

Notochord and sheath destabilisation interfere with vertebral column segmentation and mineralisation in kita-RAS. (A) Diagram illustrating the expression of entpd5(+) in controls. These domains are interspaced by entpd5(−), which will form the intervertebral discs (IVDs), under normal situation. (B) Numbers of entpd5+ segments counted from zebrafish at 5 dpf with length between 3.8 mm and 4.1 mm. Note the slow formation of segments in kita-RAS (n=24) in comparison to controls (n=25). Unpaired, nonparametric t-test and Mann–Whitney test were used. Data are mean±s.d. (C) entpd5 expression in control (kita:mCherry) and kita-RAS at 8 dpf. Maximum projections from z-stacks of notochord (kita) and entpd5:kaeda are shown for merged channels. Selected regions (dashed line boxes) are shown at higher magnification. Note abnormal expression pattern of entpd5 (arrows) coinciding with the wounded region (dashed line arrows). (D) Diagram illustrating where the notochord sheath will mineralise from entpd5+ regions and form the chordacentra (vertebral primordium). (E) The lengths of the first seven segments of the vertebral column were measured from controls (n=24 fish) and kita-RAS (n=23 fish) of similar total length (5 mm≤fish length<6 mm) at 14 dpf. Graph displays seven segments and their lengths. Note the high variability in kita-RAS. Unpaired, nonparametric, multiple t-tests were performed for statistical analysis. Lines indicate the means. P-values are shown when significant (P<0.05). (F) Alizarin Red S and Calcein Green (bone staining) were used to visualise the mineralised chordacentra at 14 dpf in controls and kita-RAS. Maximum projections from confocal images are shown for merged channels. Selected regions (dashed line boxes) are shown at higher magnification. Incomplete mineralisation of the chordacenta (arrow) and ectopic mineralisation towards the IVD domain (arrowhead) were detected in kita-RAS. Scale bars: 100 µm. (G) Alizarin Red S staining was performed on 14 dpf fixed samples for measurements of segment lengths. Note uneven mineralisation of the segments. Selected regions (dashed line boxes) are shown at higher magnification. The first seven vertebral segments are indicated. Scale bars: 500 µm.

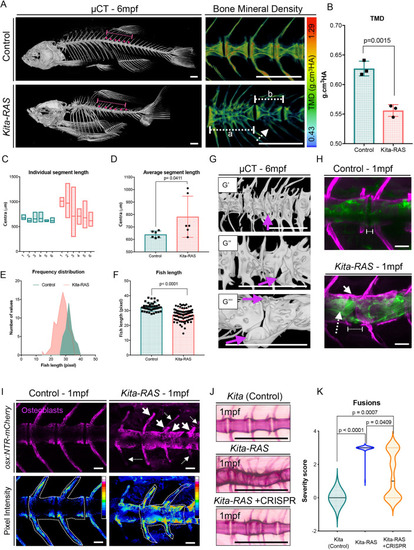
(A) µCT images of adult (6-month-old; 6 mpf) control (kita-mCherry) and kita-RAS. Note severe fusions and shortening of the fish length in kita-RAS. A zoomed region, colour coded for bone mineral density [tissue mineral density (TMD); in g/cm3 hydroxyapatite (HA)], is shown as an example. Note the decreased mineral density in kita-RAS. Fusions compromising two (white dashed line, b) to several vertebrae (white dashed line, a) are shown. The arches are also compromised (white dashed line arrow). Scale bars: 500 µm. (B) TMD calculation. Unpaired two-tailed Student's t-test was used as a statistical test (two vertebrae per fish were analysed; control n=3 fish, kita-RAS n=3 fish). (C) Frequency distribution of the length of six consecutive segments, separated by a defined IVD space, were measured in Amira using 3D perspective measurement. The studied region is shown with a dashed line and magenta dots in A. kita-RAS show high variability in length of segments. (D) The average segment length was increased in kita-RAS. Six vertebrae per fish were analysed; control n=3 fish, kita-RAS n=3 fish. Unpaired, nonparametric t-test (Mann–Whitney test). (E) Frequency distribution of fish length in controls and kita-RAS measured in pixels, from X-ray images. (F) Fish lengths (measured in pixels) of controls (n=40) and kita-RAS (n=78). Unpaired, nonparametric t-test (Mann–Whitney test). (G) Higher-resolution µCT images to show abnormalities in detail. G′, fusions of several vertebrae and hemicentra (arrow). G″, lateral view of a hemicentra (arrow). G‴, ventral view of a hemicentra (arrows). Scale bars: 500 µm. (H) One-month-old (1 mpf) control (kita-mCherry) and kita:RAS-GFP stained with Calcein Green and Alizarin Red S, respectively, to label the bone (magenta). In kita-RAS, a hyperplastic notochord cell is indicated with a white dashed line arrow, mineralised IVD is indicated with a white arrow, and a region of incomplete mineralisation and future cleft is marked with a dashed line. Note that notochordal cells fail to organise in IVD domains. Scale bars: 50 µm. (I) 1 mpf control and kita:RAS-GFP showing osteoblasts [Tg(osx:NTR-mCherry)]. Arrows indicate regions of increased osteoblasts; dashed line arrows show regions lacking osteoblasts and abnormal growth of arches. Pictures were processed to show pixel intensity (blue=low intensity), to visualise where osteoblasts are highly expressed. Two vertebrae in each fish were selected for quantification of mean pixel intensity. (J) Alizarin Red S staining of 1 mpf kita, kita-RAS and kita-RAS+CRISPR. Note an intermediate (less severe) phenotype in kita-RAS+CRISPR, suggesting rescue of bone phenotype. (K) Violin plot to show the distribution of vertebral column severity scores, from 0 (less severe) to 3 (most severe), in kita (n=47), kita-RAS (n=44) and kita-RAS+CRISPR (n=83). One-way ANOVA and Tukey's multiple comparisons test were used; P-values are indicated when significant. Scale bars: 50 µm.

PHENOTYPE:
Fish:
Observed In:
Stage: Adult

Fibrotic nucleus pulposus and abnormal annulus fibrosus in kita-RAS resemble intervertebral disc degeneration. (A) Schematic of a histological section of the vertebral column of zebrafish (off from the midline) showing two consecutive IVDs. AF, annulus fibrosus; b, bone; co, collagen layers; el, elastin layer; IVD, intervertebral disc; NP, nucleus pulposus; ns, notochord sheath. (B) Histological sections of adult control (kita-mCherry) and kita-RAS fish stained with Toluidine Blue (morphology), AFOG (fibrosis) and Picro-Sirius Red (fibrosis and collagen fibre thickness). Bone (b) and inner nucleus pulposus (NP) are indicated on the control Toluidine Blue picture. Abnormal fibrosis (black, orange and white arrows), cellularity and disorganisation of the NP were detected in kita-RAS fish. The regions within the dashed line boxes (Picro-Sirius Red staining) are shown at higher magnification to show the bone in detail. Asterisks were added to help with orientation, and they show the same position in lower- and higher-magnification pictures. Poor quality of bone can be measured by the tones of colours from Picro-Sirius Red staining. Thicker fibres are red and thinner fibres are blue/green (colour bar). (C) Collagen fibre quantification was performed by determining the means of pixel colours (red, green and blue) in the Picro-Sirius Red staining pictures. Note a reduction of thick (red) and very thin (blue) fibres in kita-RAS (n=9 vertebrae, n=3 fish) in comparison to controls (n=6 vertebrae, n=3 fish). Unpaired, nonparametric t-test and Mann–Whitney test were used. Data are mean±s.d.; P-values are indicated when significant (P<0.05). (D) Toluidine Blue staining to show details of the AF area in control (kita-mCherry) and kita-RAS. Note the loss of the layers of collagen and elastin in kita-RAS and disorganised and higher number of osteoblasts (arrow). Internal collagen layer is mixed with abnormal cells (dashed line arrow). Scale bars: 50 µm.

Pre-neoplastic notochord cells drive abnormal vertebral column development and interfere with bone homeostasis in zebrafish. (A) In wild-type zebrafish, the notochord is formed by a notochord sheath epithelium (nse) wrapping notochord vacuolated cells (nvc). (B) Innate immune cells, in particular neutrophils (n) and macrophages (m), are not directed to the notochord and they do not trespass the ns. (C) The segmentation of the notochord to form the future vertebrae and IVDs starts with differentiation of notochord sheath cells to express entpd5 in interspaced domains. (D) These segments will mineralise (chordacentra) and originate individual vertebrae; intersegment regions will form the IVDs. (E) Osteoblasts (ob) and osteoclasts (oc) are evenly distributed in the centrae and arches. (A′) When RAS is expressed in the notochord cells, transformed vacuolated cells collapse and a fibrous ‘scar’ tissue is formed. (B′) The notochord sheath layer is destabilised, triggering a prolonged recruitment of neutrophils and macrophages. (C′) The notochord sheath cells fail to differentiate and to express entpd5 in specific domains, showing a delay and abnormal pattern of expression. (D′) This leads to abnormal chordacentra formation, consequently leading to (E′) fusions, clefts and abnormalities in the adult vertebral column. IVDs are lost due to fusions. Osteoblasts and osteoclasts are distributed disorderly in centra and arches and in higher numbers. Moreover, pre-neoplastic cells continue to adulthood, leading to NP abnormalities and poor bone quality. Chordoma development and bone phenotype can be controlled by immunomodulation of neutrophils and macrophages.

Acknowledgments
This image is the copyrighted work of the attributed author or publisher, and ZFIN has permission only to display this image to its users. Additional permissions should be obtained from the applicable author or publisher of the image. Full text @ Dis. Model. Mech.